May 27, 2025 a 04:45 pm

MU: Fibonacci Analysis - Micron Technology, Inc.
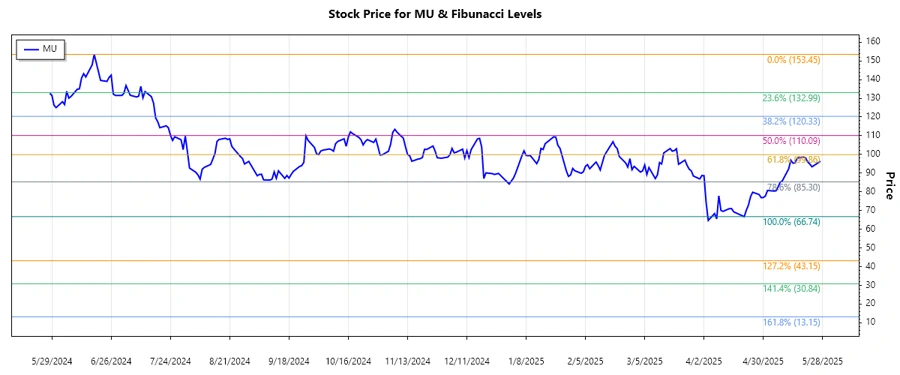
The recent analysis of Micron Technology, Inc. reveals a dominant downward trend over the past few months. The company's robust product lineup in memory and storage technology, however, positions it well against temporary market downturns. Considering the fluctuations in the semiconductor market, investors should remain cautious yet optimistic about a potential upside as the market stabilizes.
Fibonacci Analysis
| Start Date | End Date | High | Low |
|---|---|---|---|
| 2024-06-18 | 2025-05-27 | $153.45 (2024-06-18) | $66.74 (2025-04-21) |
| Fibonacci Level | Price Level |
|---|---|
| 0.236 | $89.47 |
| 0.382 | $103.69 |
| 0.5 | $110.10 |
| 0.618 | $116.51 |
| 0.786 | $128.47 |
The current price of $96.3 indicates that the stock is in the 0.236-0.382 retracement zone, suggesting potential support.
This technical level indicates that the stock may rebound as it tests the support zone, though caution is advised given the broader downtrend.
Conclusion
The analysis of Micron Technology, Inc. suggests a presently challenged stock price amidst a broader market downturn for semiconductor products. The current retracement level hints at future support, albeit in a volatile sector characterized by supply chain fluctuations and evolving market demand. While the technical indicators may suggest possible rebounds from this steep decline, investors should weigh potential cyclical recovery against macroeconomic uncertainties that could further pressure the company's stock performance.
Smart Data Insight
Master the Perfect Entry & Exit for this Stock
Don't leave your profits to chance. Historically, this stock follows specific seasonal patterns that institutional traders use to maximize returns.
- ✅ Identify the "Golden Buying Window"
- ✅ Avoid high-risk correction cycles
- ✅ Backtested data from the last 20+ years