
June 20, 2026 a 07:46 am
MU: Dividend Analysis - Micron Technology, Inc.
Micron Technology, Inc. showcases a unique approach with a modest dividend yield but consistent growth over the past five years. Their commitment to dividends is commendable despite significant industry challenges. Investors should note the relatively low payout ratios, indicating room for dividend growth and sustainability.
📊 Overview
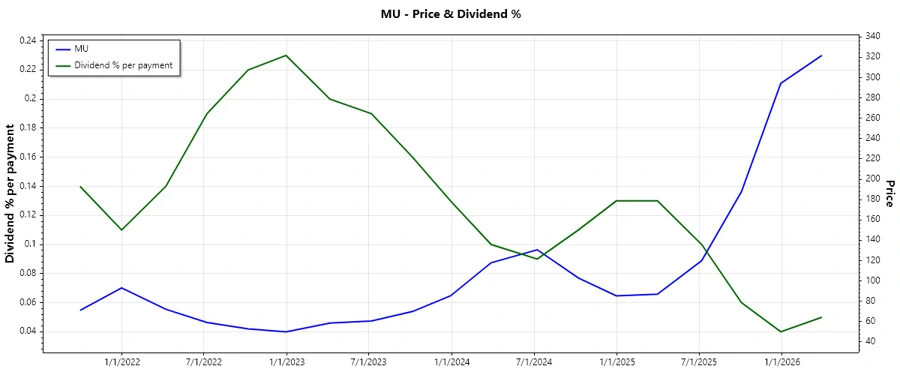
Micron Tech operates in a dynamic sector where dividend policies greatly affect investor choices. Its current dividend yield stands at 0.15%, highlighting its prudent dividend distribution strategy. The company has maintained dividend payments over the last 12 years, with no recorded cuts or suspensions.
| Detail | Value |
|---|---|
| Sector | Semiconductors |
| Dividend yield | 0.15% |
| Current dividend per share | 0.47 USD |
| Dividend history | 12 years |
| Last cut or suspension | None |
🗣️ Dividend History
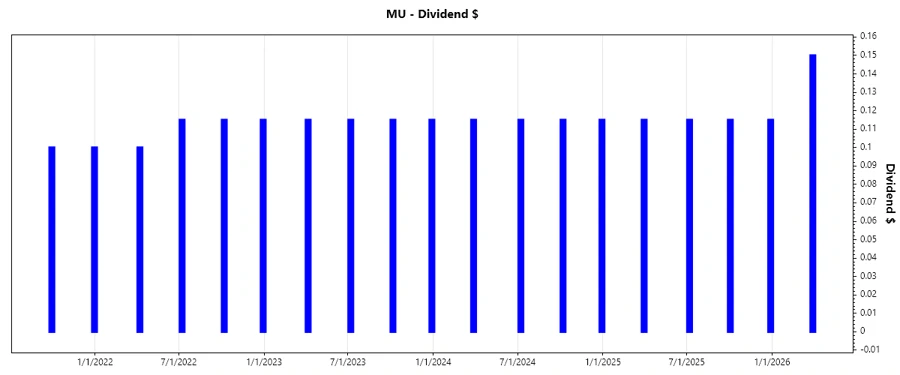
The dividend history of Micron underscores its commitment to shareholders by offering consistent payouts amidst the volatile semiconductor market. Studying the trend of previous dividends can offer insights into future policies.
| Year | Dividend per Share (USD) |
|---|---|
| 2026 | 0.15 |
| 2025 | 0.460 |
| 2024 | 0.460 |
| 2023 | 0.460 |
| 2022 | 0.445 |
📈 Dividend Growth
Micron's dividend growth demonstrates its mild yet promising progression as the company embraces long-term financial strategies. Tracking growth over the past three and five years reveals this trend.
| Time | Growth |
|---|---|
| 3 years | 1.11% |
| 5 years | 79.05% |
The average dividend growth is 79.05% over 5 years. This shows moderate but steady dividend growth.
✅ Payout Ratio
The payout ratio of Micron offers insights into its dividend strategies, focusing on sustainability and future growth potential. The relatively low ratios signify financial room to expand their dividend payouts.
| Key figure | Ratio |
|---|---|
| EPS-based | 2.18% |
| Free cash flow-based | 5.13% |
Both the EPS-based (2.18%) and FCF-based (5.13%) payout ratios reflect a conservative approach with ample coverage for dividend payouts, allowing flexibility for future increases.
🔄 Cashflow & Capital Efficiency
These metrics are essential in evaluating Micron's operational prowess and capital management. They reflect how investments efficiently turn into stockholder value.
| Metric | 2025 | 2024 | 2023 |
|---|---|---|---|
| Free Cash Flow Yield | 1.23% | 0.11% | -8.00% |
| Earnings Yield | 6.27% | 0.74% | -7.63% |
| CAPEX to Operating Cash Flow | 90.48% | 98.58% | 492.37% |
| Stock-based Compensation to Revenue | 2.60% | 3.32% | 3.84% |
| Free Cash Flow / Operating Cash Flow Ratio | 9.52% | 1.42% | -392.37% |
Micron’s fluctuating free cash flow and capital ratios highlight potential volatility, calling for reinforced capital deployment strategies to stabilize returns.
⚖️ Balance Sheet & Leverage Analysis
The analysis of Micron's balance sheet ratios provides insights into its financial resilience, debt management, and liquidity operations.
| Metric | 2025 | 2024 | 2023 |
|---|---|---|---|
| Debt-to-Equity | 28.21% | 31.04% | 31.58% |
| Debt-to-Assets | 18.45% | 20.18% | 21.68% |
| Debt-to-Capital | 22.00% | 23.68% | 24.00% |
| Net Debt to EBITDA | 0.30 | 0.78 | 2.42 |
| Current Ratio | 2.52 | 2.64 | 4.46 |
| Quick Ratio | 1.79 | 1.68 | 2.70 |
The ratios depict a relatively stable debt structure, although a close eye on leverage is advisable to ensure they align with industry standards and economic conditions.
📊 Fundamental Strength & Profitability
Evaluating core profitability metrics permits a deep dive into Micron's overall operational success and competitive positioning within the semiconductor sector.
| Metric | 2025 | 2024 | 2023 |
|---|---|---|---|
| Return on Equity | 15.76% | 1.72% | -13.22% |
| Return on Assets | 10.31% | 1.12% | -9.08% |
| Margins: Net | 22.84% | 3.10% | -37.54% |
| Margins: EBIT | 27.13% | 4.96% | -35.13% |
| Margins: EBITDA | 49.47% | 35.62% | 14.23% |
| Margins: Gross | 39.79% | 22.35% | -9.11% |
| Research & Development to Revenue | 10.16% | 13.66% | 20.04% |
The data reflects Micron’s ability to maintain robust profits with careful attention to R&D investment, crucial amid rapid technological advancements.
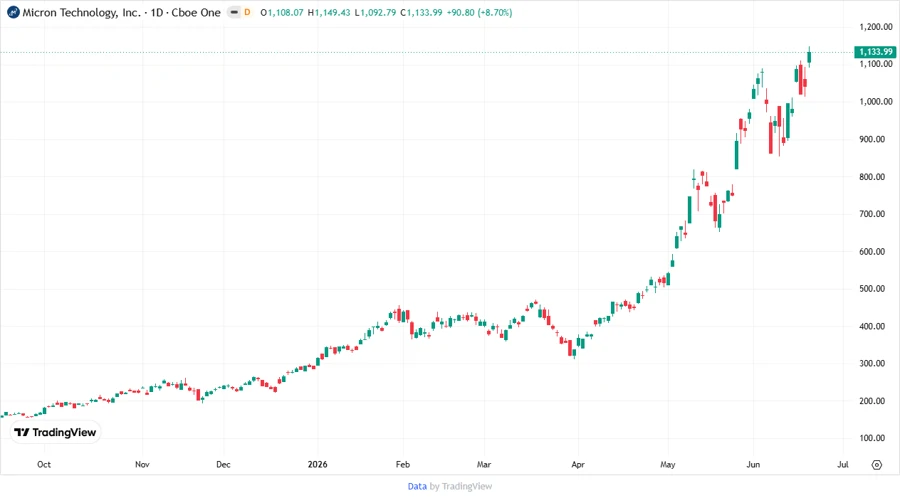
📉 Price Development
🎯 Dividend Scoring System
| Criteria | Score | Bar |
|---|---|---|
| Dividend Yield | 2 | |
| Dividend Stability | 4 | |
| Dividend Growth | 3 | |
| Payout Ratio | 5 | |
| Financial Stability | 4 | |
| Dividend Continuity | 4 | |
| Cashflow Coverage | 3 | |
| Balance Sheet Quality | 4 |
Total Score: 29/40
🔍 Rating
Micron Technology, Inc. exhibits a solid dividend performance with its prudent payout strategy, enabling potential growth given its financial infrastructure. Investors may find the stock appealing for a balanced portfolio approach. Recommendation: Hold.
Smart Data Insight
Master the Perfect Entry & Exit for this Stock
Don't leave your profits to chance. Historically, this stock follows specific seasonal patterns that institutional traders use to maximize returns.
- ✅ Identify the "Golden Buying Window"
- ✅ Avoid high-risk correction cycles
- ✅ Backtested data from the last 20+ years