May 01, 2026 a 03:31 pm

MU: Dividend Analysis - Micron Technology, Inc.
The dividend profile of Micron Technology, Inc. reflects a cautious yet stable approach to returning value to shareholders. With a modest dividend yield and historical commitment to maintaining payouts, investors might find potential growth. However, the current low yield and a modest payout ratio suggest that reinvestment in growth might be prioritized.
Overview 📊
Examining the core metrics of Micron Technology's dividend profile reveals its commitment to preserving and growing shareholder value through tangible returns. Here's a breakdown:
| Sector | Dividend Yield | Current Dividend Per Share | Dividend History | Last Cut/Suspension |
|---|---|---|---|---|
| Technology | 0.15% | $0.47 | 12 years | None |
Dividend History 🗣️
The history of dividends indicates a strong dedication to returns; the consistency offers confidence to long-term stakeholders. However, the low current yield means other financial metrics and growth opportunities are vital for a comprehensive assessment.
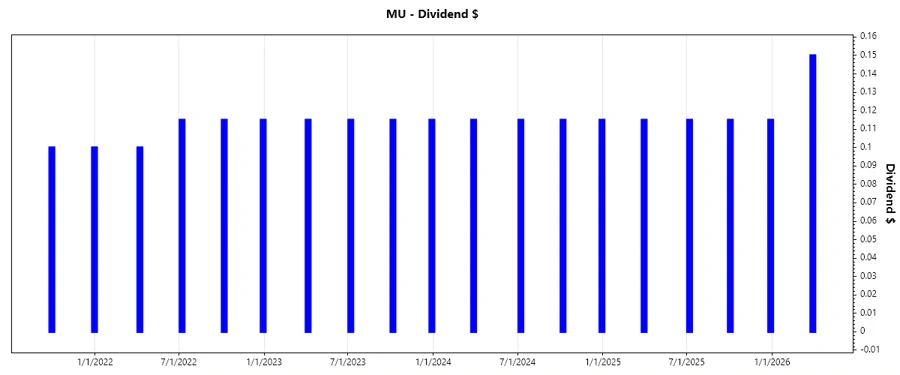
| Year | Dividend Per Share |
|---|---|
| 2026 | 0.15 |
| 2025 | 0.46 |
| 2024 | 0.46 |
| 2023 | 0.46 |
| 2022 | 0.445 |
Dividend Growth 📈
Observing the dividend growth metrics, it seems Micron Technology has maintained discreet but promising enhancements over the years. These indices are critical in forecasting a future of incremental shareholder returns.
| Time | Growth |
|---|---|
| 3 years | 1.11% |
| 5 years | 79.05% |
The average dividend growth is 79.05% over 5 years. This shows moderate but steady dividend growth.
Payout Ratio 📉
The payout ratios of Micron Technology are insightful for gauging its earnings efficiency and resource allocation. Balancing between reinvestment and dividends is achieved with a disciplined financial policy.
| Key Figure Ratio |
|---|
| EPS-based: 2.18% |
| Free cash flow-based: 5.13% |
The low payout from both EPS (2.18%) and FCF (5.13%) indicates a conservative approach, leaving room for future growth and stability.
Cashflow & Capital Efficiency 💰
Examining cash flow data is indispensable for understanding the liquidity and sustainability of the company's operations and its ability to sustain and grow dividends.
| Metric | 2025 | 2024 | 2023 |
|---|---|---|---|
| Free Cash Flow Yield | 1.23% | 0.11% | -8.00% |
| Earnings Yield | 6.27% | 0.74% | -7.63% |
| CAPEX to Operating Cash Flow | 0.90 | 0.98 | 4.92 |
| Stock-based Compensation to Revenue | 2.60% | 3.32% | 3.84% |
| FCF/Operating Cash Flow Ratio | 9.52% | 1.42% | -392.37% |
The varying cash flow metrics highlight operational efficiency challenges, emphasizing the need for careful capital allocation to sustain growth trajectories.
Balance Sheet & Leverage Analysis 📖
Assessing leverage ratios and current ratios provides clarity on the company’s debt handling and financial foundation, crucial for prudent dividend policy decisions.
| Metric | 2025 | 2024 | 2023 |
|---|---|---|---|
| Debt-to-Equity | 0.28 | 0.31 | 0.32 |
| Debt-to-Assets | 0.18 | 0.20 | 0.22 |
| Debt-to-Capital | 0.22 | 0.24 | 0.24 |
| Net Debt to EBITDA | 0.30 | 0.78 | 2.42 |
| Current Ratio | 2.52 | 2.64 | 4.46 |
| Quick Ratio | 1.79 | 1.68 | 2.70 |
| Financial Leverage | 1.53 | 1.54 | 1.46 |
Overall, the company's lean leverage indicates a strong and resilient balance sheet conducive for long-term financial stability and potential dividend increases.
Fundamental Strength & Profitability ⚖️
Company fundamentals and profitability ratios provide insight into the overall financial health, aiding in making informed predictions about future dividend prospects.
| Metric | 2025 | 2024 | 2023 |
|---|---|---|---|
| Return on Equity | 15.76% | 1.72% | -13.22% |
| Return on Assets | 10.31% | 1.12% | -9.08% |
| Net Margin | 0.23 | 0.03 | -0.38 |
| EBIT Margin | 0.27 | 0.05 | -0.35 |
| EBITDA Margin | 0.49 | 0.36 | 0.14 |
| Gross Margin | 0.40 | 0.22 | -0.09 |
| R&D to Revenue | 10.16% | 13.66% | 20.04% |
Maintaining healthy profitability metrics fortifies Micron Technology's capacity to support ongoing dividend payments.
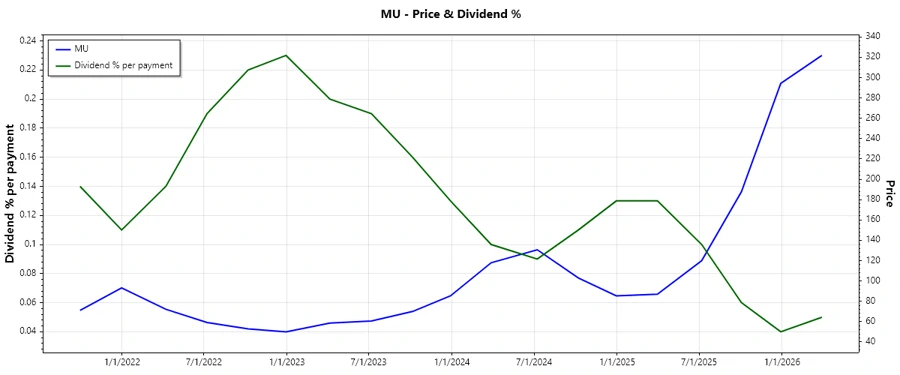
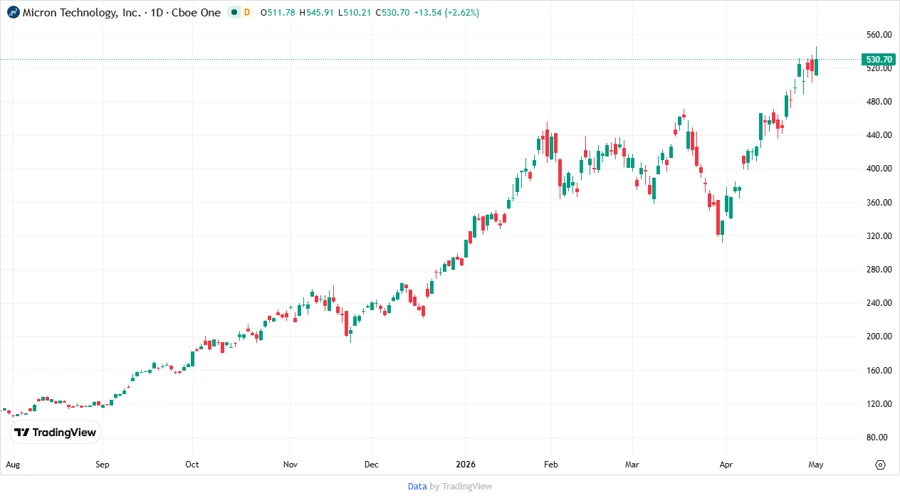
Price Development 📈
Dividend Scoring System ✅
| Category | Details | Score |
|---|---|---|
| Dividend Yield | 0.15% | |
| Dividend Stability | 12 years of history | |
| Dividend Growth | 5-year growth of 79.05% | |
| Payout Ratio | EPS-based @ 2.18% | |
| Financial Stability | Debt-to-equity ratio of 0.28 | |
| Dividend Continuity | No recent cuts/suspensions | |
| Cashflow Coverage | FCF/OCF ratio at 9.52% | |
| Balance Sheet Quality | Solid ratios |
Total Dividend Score: 28/40
Rating 🏆
Micron Technology, Inc. showcases a balanced dividend strategy with moderate payouts and a healthy growth trajectory. While the yield is relatively low, strong growth prospects and robust financial health make it a viable option for growth-oriented dividend investors. Consider investing while keeping future economic conditions in mind, as these might affect dividend policies.
Smart Data Insight
Master the Perfect Entry & Exit for this Stock
Don't leave your profits to chance. Historically, this stock follows specific seasonal patterns that institutional traders use to maximize returns.
- ✅ Identify the "Golden Buying Window"
- ✅ Avoid high-risk correction cycles
- ✅ Backtested data from the last 20+ years