February 20, 2026 a 03:31 am

MU: Dividend Analysis - Micron Technology, Inc.
Micron Technology, Inc. presents a unique dividend profile in the technology sector. With a modest dividend yield of 0.16% and a consistent 11-year dividend history, Micron demonstrates reliability, although its growth in dividends has been slow. The company’s financials suggest stability, but the relatively low payout ratios indicate potential for dividend growth. As part of the broader tech market, which is not traditionally known for high yields, Micron remains a compelling option for those prioritizing dividend consistency over immediate yield.
📊 Overview
| Metric | Details |
|---|---|
| Sector | Technology |
| Dividend yield | 0.16% |
| Current dividend per share | 0.47 USD |
| Dividend history | 11 years |
| Last cut or suspension | 1996 |
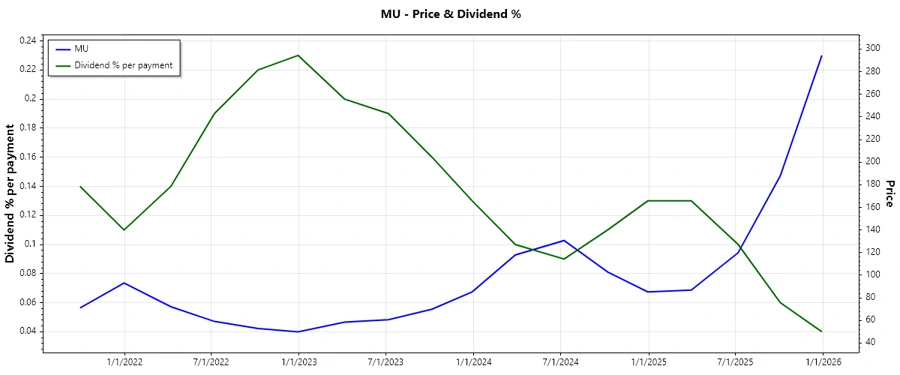
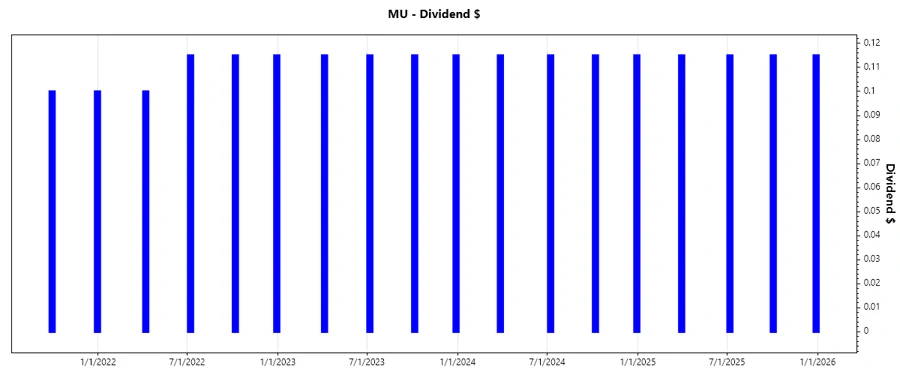
📈 Dividend History
The 11-year dividend history of Micron Technology showcases their commitment to shareholders. Despite the competitive tech landscape, they have managed to maintain dividend payouts consistently. This stability is crucial for investors looking for reliable income streams, albeit modest.
| Year | Dividend Per Share (USD) |
|---|---|
| 2025 | 0.460 |
| 2024 | 0.460 |
| 2023 | 0.460 |
| 2022 | 0.445 |
| 2021 | 0.200 |
🚀 Dividend Growth
The historical growth rates offer insight into Micron's dividends—as the firm has shown a 5-year growth rate of 0.79% and a 3-year rate at a minimal 0.01%. Such figures indicate stable but subdued progression, often signifying the company’s conservative approach in dividend increases, preserving cash flow for other ventures.
| Time | Growth |
|---|---|
| 3 years | 0.01% |
| 5 years | 0.79% |
The average dividend growth is 0.79% over 5 years. This shows moderate but steady dividend growth.
✅ Payout Ratio
Payout ratios are critical in assessing a company's financial health and sustainability of its dividend. With an EPS-based payout ratio of 4.42% and an FCF-based ratio of 4.42%, Micron portrays a conservative payout strategy. These conservative figures suggest a capacity to maintain or increase dividends without over-leverage.
| Key figure | Ratio |
|---|---|
| EPS-based | 4.42% |
| Free cash flow-based | 4.42% |
The low payout ratios depicted through both EPS and FCF metrics let us infer a favorable position for dividend extensions, indicating strong capability to uphold distributions even amidst potential earnings volatility.
💰 Cashflow & Capital Efficiency
A stable cash flow and effective capital allocation enhance Micron's ability to support its dividend policy. Monitoring free cash flow yields, earnings yields, and capex ratios over time gives us insights into their capital efficiency and cash flow stability.
| Metric | 2025 | 2024 | 2023 |
|---|---|---|---|
| Free Cash Flow Yield | 1.23% | 0.11% | -8.00% |
| Earnings Yield | 6.27% | 0.74% | -7.63% |
| CAPEX to Operating Cash Flow | 0.90 | 0.99 | 4.92 |
| Stock-based Compensation to Revenue | 2.60% | 3.32% | 3.84% |
| Free Cash Flow / Operating Cash Flow Ratio | 0.95 | 0.01 | -3.92 |
Micron's cash flow stability and capital efficiency reveal a fluctuating scenario recently, with an impressive free cash flow generation in 2025 following a challenging backdrop in prior years, suggesting improving capital returns.
📊 Balance Sheet & Leverage Analysis
Understanding the financial leverage and debt management strategies of Micron provides insight into its ability to maneuver economic uncertainties without compromising solvency.
| Metric | 2025 | 2024 | 2023 |
|---|---|---|---|
| Debt-to-Equity | 28.21% | 31.04% | 31.58% |
| Debt-to-Assets | 18.45% | 20.18% | 21.68% |
| Debt-to-Capital | 22.00% | 23.69% | 24.00% |
| Net Debt to EBITDA | 0.16 | 0.78 | 2.42 |
| Current Ratio | 2.52 | 2.64 | 4.46 |
| Quick Ratio | 1.79 | 1.68 | 2.70 |
| Financial Leverage | 1.53 | 1.54 | 1.46 |
The leverage dynamics denote Micron's conservative debt levels with improving leverage in recent years, ideal for maintaining financial flexibility and supporting potential dividend enrichments without stressing the balance sheet.
📈 Fundamental Strength & Profitability
Evaluating Micron’s profitability and its fundament indicators such as margins and returns highlights its strategic positioning within the technology space, balancing profitability with revenue inflation.
| Metric | 2025 | 2024 | 2023 |
|---|---|---|---|
| Return on Equity | 15.76% | 1.72% | -13.22% |
| Return on Assets | 10.31% | 1.12% | -9.08% |
| Net Margin | 22.84% | 3.10% | -37.53% |
| EBIT Margin | 27.13% | 4.96% | -35.13% |
| EBITDA Margin | 49.47% | 35.62% | 14.23% |
| Gross Margin | 39.79% | 22.35% | -9.11% |
| Research & Development to Revenue | 9.60% | 13.66% | 20.04% |
The profitability matrices have varied over the years with notable profits in more recent fiscal years, alluding to Micron's tightening resource application and enhanced market position.
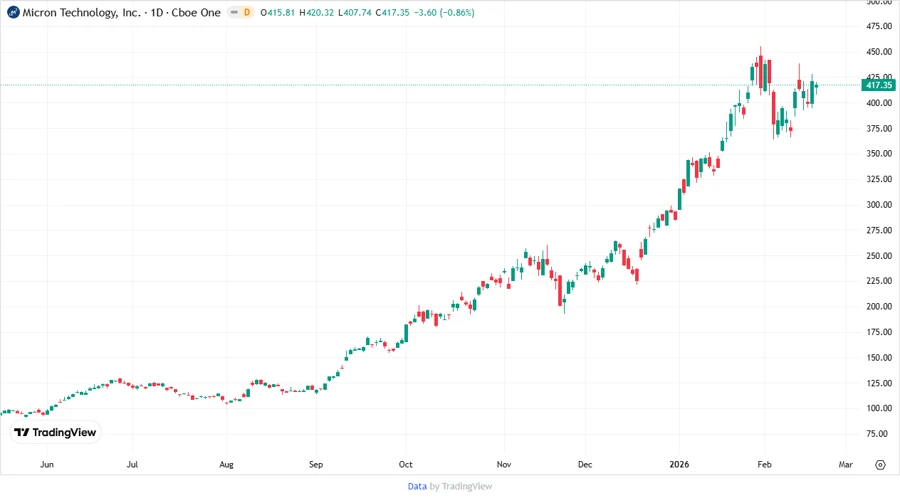
📉 Price Development
🏆 Dividend Scoring System
| Category | Score | Description |
|---|---|---|
| Dividend yield | 2 | |
| Dividend Stability | 4 | |
| Dividend growth | 2 | |
| Payout ratio | 5 | |
| Financial stability | 4 | |
| Dividend continuity | 5 | |
| Cashflow Coverage | 3 | |
| Balance Sheet Quality | 4 |
Total Score: 29/40
🗣️ Rating
Micron Technology, Inc., rated based on its dividend profile, holds a solid standing for risk-tolerant dividend seekers with a long-term perspective. Due to its conservative payout ratio and consistent history of dividends, it is well-suited for those oriented towards sustained moderate income despite its low yield and limited growth. Its financial stability provides a solid backbone for expecting this continuity and future potential growth.
Smart Data Insight
Master the Perfect Entry & Exit for this Stock
Don't leave your profits to chance. Historically, this stock follows specific seasonal patterns that institutional traders use to maximize returns.
- ✅ Identify the "Golden Buying Window"
- ✅ Avoid high-risk correction cycles
- ✅ Backtested data from the last 20+ years