December 11, 2025 a 11:31 am

MU: Dividend Analysis - Micron Technology, Inc.
Welcome to our detailed analysis of Micron Technology's dividend viability and growth potential. Micron Technology's dividend profile features modest yields but promising growth metrics. In this report, we will delve into the financial metrics that influence dividend sustainability and payout policy. Stay tuned as we explore the key elements that make Micron Technology an interesting proposition for dividend investors.
Overview 📊
Micron Technology, Inc. operates within the technology sector, currently exhibiting a dividend yield of 0.24%, which is relatively low. However, despite this low yield, the company has managed to maintain a dividend payment history spanning 11 years without a recent cut or suspension. Such sustainability highlights the firm's commitment to providing returns to shareholders through a steady dividend policy.
| Metric | Value |
|---|---|
| Sector | Technology |
| Dividend yield | 0.24% |
| Current dividend per share | 0.47 USD |
| Dividend history | 11 years |
| Last cut or suspension | None |
Dividend History 📈
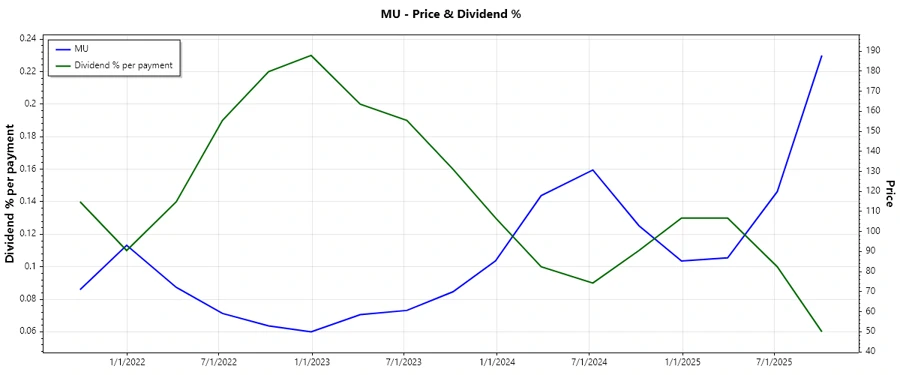
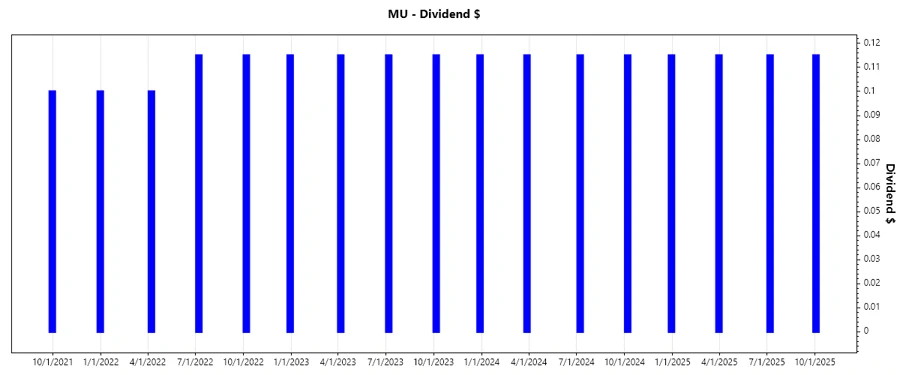
The dividend history of Micron Technology showcases a consistent performance over the years, demonstrating financial resilience. It is crucial for potential investors to consider this past performance as it often serves as an indicator of future reliability and stability in dividend payments.
Figure: Micron Technology's historical dividend payouts
| Year | Dividend Per Share (USD) |
|---|---|
| 2025 | 0.345 |
| 2024 | 0.460 |
| 2023 | 0.460 |
| 2022 | 0.445 |
| 2021 | 0.200 |
Dividend Growth 📈
The examination of dividend growth over recent years reveals a strategic increase in dividend payouts, indicative of escalating company profitability and ambition. Monitoring dividend growth rates can be instrumental for investors anticipating regular income growth.
| Time | Growth |
|---|---|
| 3 years | 32.00% |
| 5 years | 79.05% |
The average dividend growth is 79.05% over 5 years. This shows moderate but steady dividend growth, positioning Micron Technology as a potential choice for investors seeking dividend growth.
Figure: Dividend growth trajectory of Micron Technology
Payout Ratio ⚠️
Payout ratios provide insights into the sustainability of dividend distributions relative to earnings and cash flows. Generally, a lower payout ratio suggests a healthy buffer to continue paying dividends during economic downturns.
| Key figure | Ratio |
|---|---|
| EPS-based | 6.11% |
| Free cash flow-based | 5.85% |
Micron Technology maintains low payout ratios with EPS (6.11%) and FCF (5.85%), indicating disciplined dividend policies aligned with earnings and cash flow realities, providing confidence in future dividend sustainability.
Cashflow & Capital Efficiency 📉
Effective management of cash flows and capital efficiency measures are pivotal to secure the funding of dividends without jeopardizing reinvestment capabilities for growth.
| Metric | 2025 | 2024 | 2023 |
|---|---|---|---|
| Free Cash Flow Yield | 1.23% | 0.11% | -8.00% |
| Earnings Yield | 6.27% | 0.73% | -7.63% |
| CAPEX / Operating Cash Flow | 90.48% | 98.58% | 492.37% |
| Stock-based Compensation to Revenue | 2.60% | 3.31% | 3.84% |
| Free Cash Flow / Operating Cash Flow Ratio | 9.52% | 1.42% | -392.37% |
The recent negative cash flow yield and high CAPEX ratios indicate potential areas of concern for Micron Technology. Investors should monitor these figures to ensure long-term sustainability and reinvestment prospects while maintaining dividend payments.
Balance Sheet & Leverage Analysis 🗣️
A strong balance sheet and controlled leverage are crucial in cushioning the company against economic challenges, ensuring liquidity and financial stability.
| Metric | 2025 | 2024 | 2023 |
|---|---|---|---|
| Debt-to-Equity | 28.21% | 31.04% | 31.58% |
| Debt-to-Assets | 18.45% | 20.18% | 21.68% |
| Debt-to-Capital | 22.00% | 23.69% | 24.00% |
| Net Debt to EBITDA | 0.30 | 0.78 | 2.42 |
| Current Ratio | 2.52 | 2.64 | 4.46 |
| Quick Ratio | 1.79 | 1.68 | 2.70 |
Micron Technology's healthy leverage and robust liquidity metrics foster financial stability, with solid current and quick ratios reflecting a strong short-term financial position.
Fundamental Strength & Profitability ✅
Assuring strong profitability and efficient resource allocation is vital for the continuous growth and success of any enterprise.
| Metric | 2025 | 2024 | 2023 |
|---|---|---|---|
| Return on Equity | 15.76% | 1.72% | -13.22% |
| Return on Assets | 10.31% | 1.12% | -9.08% |
| Net Margin | 22.84% | 3.10% | -37.54% |
| EBIT Margin | 27.10% | 4.96% | -35.13% |
| Gross Margin | 39.79% | 22.35% | -9.11% |
| R&D to Revenue | 10.16% | 13.66% | 20.04% |
Despite recent challenges, Micron Technology exhibits strong profitability indicators, particularly in 2025, providing a solid foundation for future innovation and shareholder returns.
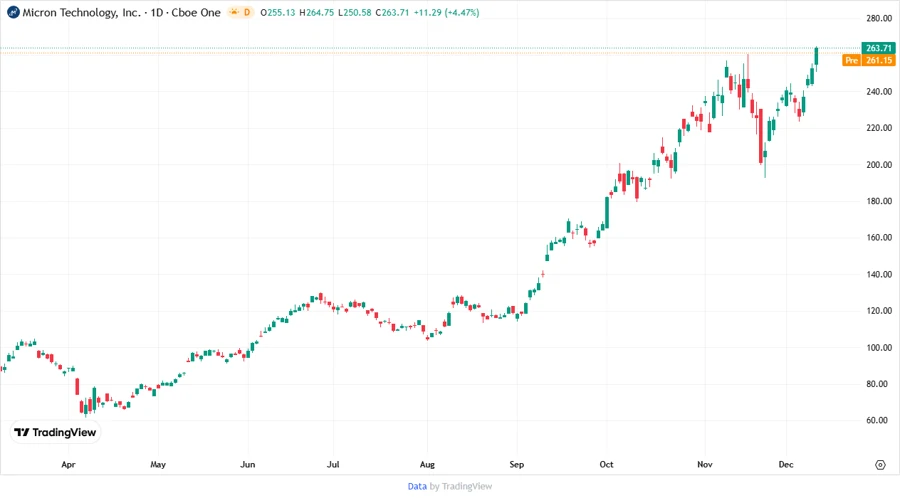
Price Development 🏷️
Figure: Recent stock price developments for Micron Technology
Dividend Scoring System 🗳️
| Criteria | Score (out of 5) | |
|---|---|---|
| Dividend yield | 2 | |
| Dividend Stability | 4 | |
| Dividend growth | 4 | |
| Payout ratio | 5 | |
| Financial stability | 4 | |
| Dividend continuity | 5 | |
| Cashflow Coverage | 3 | |
| Balance Sheet Quality | 4 |
Total Score: 31/40
Rating 💬
In conclusion, Micron Technology, Inc. presents itself as a viable choice for dividend seekers due to its disciplined payout policies and promising growth metrics. Its dividends are supported by robust financial stability and moderate growth potential. However, attention should be paid to upcoming market conditions impacting free cash flow. Overall, we recommend a cautious but optimistic investment outlook.