October 30, 2025 a 03:31 am


MU: Dividend Analysis - Micron Technology, Inc.
Micron Technology, Inc. presents a complex dividend profile marked by a modest yield yet a commitment to steady payouts, even through market fluctuations. With a solid dividend history and a commitment to growth, MU stands as an attractive prospect for dividend investors seeking long-term sustainability. However, its low dividend yield necessitates a nuanced understanding of its broader financial health and market positioning. Fiscal prudence and vigilant cash flow management underscore its strategy.
📊 Overview
In the semiconductor industry, Micron Technology, Inc. remains steadfast with a strategic emphasis on dividends.
| Key Metrics | Details |
|---|---|
| Sector | Semiconductors |
| Dividend yield | 0.24% |
| Current dividend per share | 0.47 USD |
| Dividend history | 11 years |
| Last cut or suspension | None |
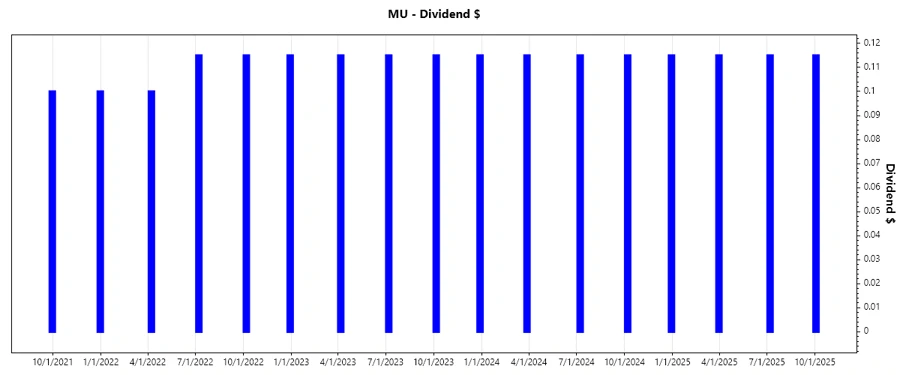
🗣️ Dividend History
An uninterrupted dividend growth over a decade illustrates MU's commitment to shareholder returns, but past reductions warrant vigilance.
| Year | Dividend per Share (USD) |
|---|---|
| 2025 | 0.345 |
| 2024 | 0.460 |
| 2023 | 0.460 |
| 2022 | 0.445 |
| 2021 | 0.2 |
📈 Dividend Growth
With growth rates of 32% annually over 3 years and 79% over 5, MU demonstrates commitment to enhancing shareholder value, albeit from a smaller base.
| Time | Growth |
|---|---|
| 3 years | 32.00% |
| 5 years | 79.05% |
The average dividend growth is 79.05% over 5 years. This shows moderate but steady dividend growth.
✅ Payout Ratio
The payout strategy at Micron Technology is conservative, with a low EPS payout ratio indicating robust earnings retention for growth and reinvestment.
| Key Figure | Ratio |
|---|---|
| EPS-based | 6.11% |
| Free cash flow-based | 5.85% |
A low payout ratio of 6.11% (EPS) and 5.85% (FCF) signifies a strong potential for future dividend increases and suggests financial prudence.
⚠️ Cashflow & Capital Efficiency
Evaluating MU’s capacity to sustain dividends, attention is given to free cash flow performance and capital efficiency ratios, crucial to operational health.
| Year | 2025 | 2024 | 2023 |
|---|---|---|---|
| Free Cash Flow Yield | 1.23% | 0.11% | -8.00% |
| Earnings Yield | 6.27% | 0.74% | -7.63% |
| CAPEX to Operating Cash Flow | 90.48% | 98.58% | 492.37% |
| Stock-based Compensation to Revenue | 2.60% | 3.32% | 3.84% |
| Free Cash Flow / Operating Cash Flow Ratio | 9.52% | 1.42% | -392.37% |
Despite challenges in cash flow stability, strong capital management with improving metrics signifies readiness for futuristic investments.
🪙 Balance Sheet & Leverage Analysis
Insight into leverage ratios highlights MU's strategic approach to debt management, vital for gauging long-term fiscal stability.
| Year | 2025 | 2024 | 2023 |
|---|---|---|---|
| Debt-to-Equity | 28.21% | 31.04% | 31.58% |
| Debt-to-Assets | 18.45% | 20.18% | 21.68% |
| Debt-to-Capital | 22.00% | 23.69% | 24.00% |
| Net Debt to EBITDA | 0.30x | 0.78x | 2.42x |
| Current Ratio | 2.52 | 2.64 | 4.46 |
| Quick Ratio | 1.79 | 1.68 | 2.70 |
MU’s leverage metrics suggest prudent debt handling, supporting creditworthiness amidst challenging market scenarios.
📉 Fundamental Strength & Profitability
Profitability metrics offer insight into MU's financial performance, integral for investor confidence in long-term returns.
| Year | 2025 | 2024 | 2023 |
|---|---|---|---|
| Return on Equity | 15.76% | 1.72% | -13.22% |
| Return on Assets | 10.31% | 1.12% | -9.08% |
| Margins: Net | 22.84% | 3.10% | -37.54% |
| Margins: EBIT | 27.10% | 4.96% | -35.13% |
| Margins: EBITDA | 49.45% | 35.62% | 14.23% |
| Margins: Gross | 39.79% | 22.35% | -9.11% |
| Research & Development to Revenue | 10.16% | 13.66% | 20.04% |
Strategic profit-margin optimization coupled with consistent R&D investment poise MU for future-ready endeavors.
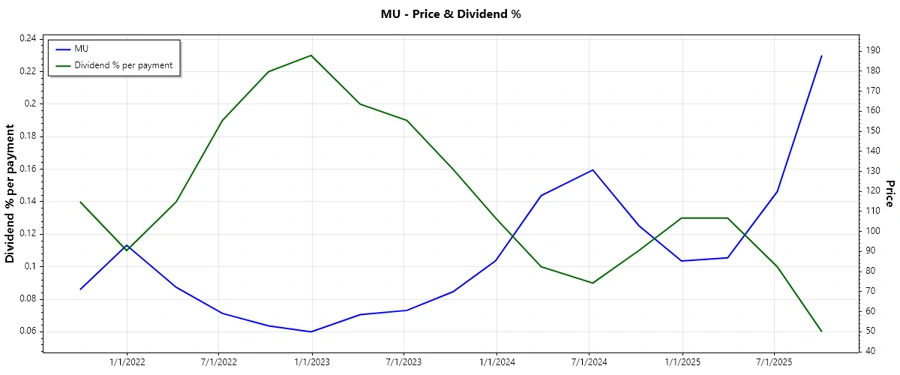
📈 Price Development
✅ Dividend Scoring System
| Category | Score | |
|---|---|---|
| Dividend yield | 2 | |
| Dividend Stability | 4 | |
| Dividend growth | 5 | |
| Payout ratio | 5 | |
| Financial stability | 3 | |
| Dividend continuity | 4 | |
| Cashflow Coverage | 2 | |
| Balance Sheet Quality | 4 |
Overall Score: 29/40
🗣️ Rating
Micron Technology, Inc. is rated positively with a robust yet cautious dividend profile underscored by strong growth metrics and sound financial management. While the low yield is a consideration, the overall strengths and commitment to increasing shareholder value signal a buy for dividend-focused investors willing to weather cyclical challenges.
Smart Data Insight
Master the Perfect Entry & Exit for this Stock
Don't leave your profits to chance. Historically, this stock follows specific seasonal patterns that institutional traders use to maximize returns.
- ✅ Identify the "Golden Buying Window"
- ✅ Avoid high-risk correction cycles
- ✅ Backtested data from the last 20+ years