May 23, 2025 a 03:31 pm


MU: Dividend Analysis - Micron Technology, Inc.
Micron Technology, Inc. presents a nuanced dividend profile characterized by a modest dividend yield and a burgeoning history of payments spanning over a decade. The company's strategic focus on consistent dividend growth and financial resilience posits it as a viable option for investors seeking potential yield growth. Analysts note Micron's adept financial management as reflected in its steady dividend performance, amplifying investor confidence.
📊 Overview
Micron Technology manifests a cautious, yet promising dividend trajectory facilitated by diligent financial oversight. The stability of its sector-specific dividend performance enhances its appeal to yield-focused investors.
| Key Metrics | Details |
|---|---|
| Sector | Technology |
| Dividend Yield | 0.53% |
| Current Dividend per Share | 0.46 USD |
| Dividend History | 11 years |
| Last Cut or Suspension | None |
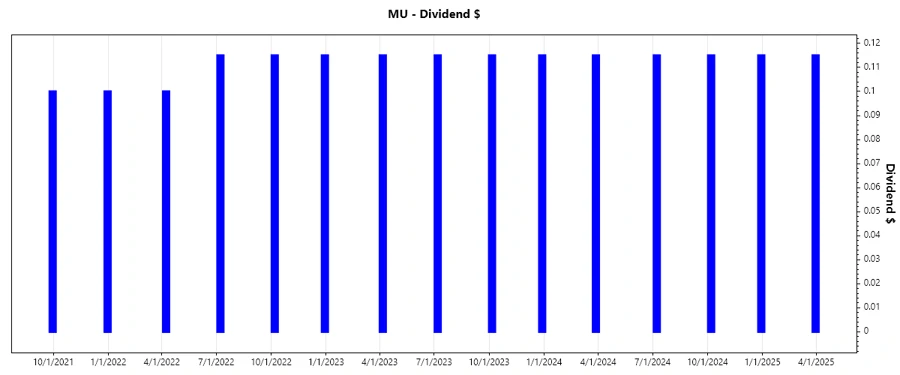
💡 Dividend History
The historical dividend analysis showcases Micron's progressive dividend policy, underscoring its commitment to shareholder returns. This long-term strategic plan fortifies investor trust and projectable income streams.
| Year | Dividend per Share (USD) |
|---|---|
| 2025 | 0.115 |
| 2024 | 0.460 |
| 2023 | 0.460 |
| 2022 | 0.445 |
| 2021 | 0.200 |
📈 Dividend Growth
Micron's focus on dividend growth reveals a strategic initiative towards enhancing shareholder value. Analyzing its growth trajectory offers insightful understanding into its financial health and investor orientation.
| Time | Growth |
|---|---|
| 3 years | 32.00% |
| 5 years | 79.05% |
The average dividend growth is 79.05% over 5 years. This shows moderate but steady dividend growth.
🏢 Payout Ratio
The payout ratio metrics implication in evaluating Micron's earnings distribution entails assessing sustainability. Their conservative EPS and FCF allocation augurs positively for financial equilibrium traversal.
| Key Figure | Ratio |
|---|---|
| EPS-based | 11.08% |
| Free Cash Flow-based | 6.60% |
Micron's low payout ratios underscore its prioritization of capital retention, providing ample scope for reinvestment and future dividend increments while preserving financial resilience.
💸 Cashflow & Capital Efficiency
Analyzing Micron's cash flow dynamics and capital efficiency serves to elucidate on its operational potency and strategic asset allocation proficiencies. It is crucial in interpreting sustainability.
| Metric | 2024 | 2023 | 2022 |
|---|---|---|---|
| Free Cash Flow Yield | 0.11% | -8.00% | 4.89% |
| Earnings Yield | 0.74% | -7.63% | 13.63% |
| CAPEX to Operating Cash Flow | 39.82% | 492.37% | 79.49% |
| Stock-based Compensation to Revenue | 2.88% | 3.84% | 1.67% |
| Free Cash Flow / Operating Cash Flow Ratio | 1.42% | -392.37% | 20.51% |
While maintaining robust CAPEX allocations, Micron's negative 2023 cash flow indicators suggest cyclical volatilities, necessitating diligent capital efficiency appraisal.
⚖️ Balance Sheet & Leverage Analysis
Assessing Micron's balance sheet fortifies insights into financial tenacity, liquidity stratagems, and leverage positioning. Key ratios pertain to evaluating debt and asset structuring.
| Ratio | 2024 | 2023 | 2022 |
|---|---|---|---|
| Debt-to-Equity | 31.04% | 31.58% | 15.06% |
| Debt-to-Assets | 20.18% | 21.68% | 11.34% |
| Debt-to-Capital | 23.69% | 24.00% | 13.09% |
| Net Debt to EBITDA | 0.59x | 2.15x | -0.04x |
| Current Ratio | 3.13 | 4.46 | 2.89 |
| Quick Ratio | 1.68 | 2.70 | 2.01 |
The data indicates solid financial grounding; nonetheless, elevated leverage in 2023 warrants cautious fiscal scrutiny amid variable market conditions.
🚀 Fundamental Strength & Profitability
Core financial metrics present a blueprint of Micron's profitability, centered on return metrics and margin efficiency—pivotal for investor valuations and corporative buoyancy.
| Metric | 2024 | 2023 | 2022 |
|---|---|---|---|
| Return on Equity | 1.72% | -13.22% | 17.41% |
| Return on Assets | 1.12% | -9.08% | 13.11% |
| Net Margin | 3.10% | -37.54% | 28.24% |
| EBIT Margin | 7.18% | -33.91% | 31.73% |
| EBITDA Margin | 38.16% | 15.99% | 54.87% |
| Gross Margin | 22.35% | -9.11% | 45.18% |
| R&D / Revenue | 11.30% | 20.04% | 10.13% |
The fundamental trends support strategic growth themes; however, 2023's profitability downturn necessitates tactical measures to rejuvenate margin integrity.
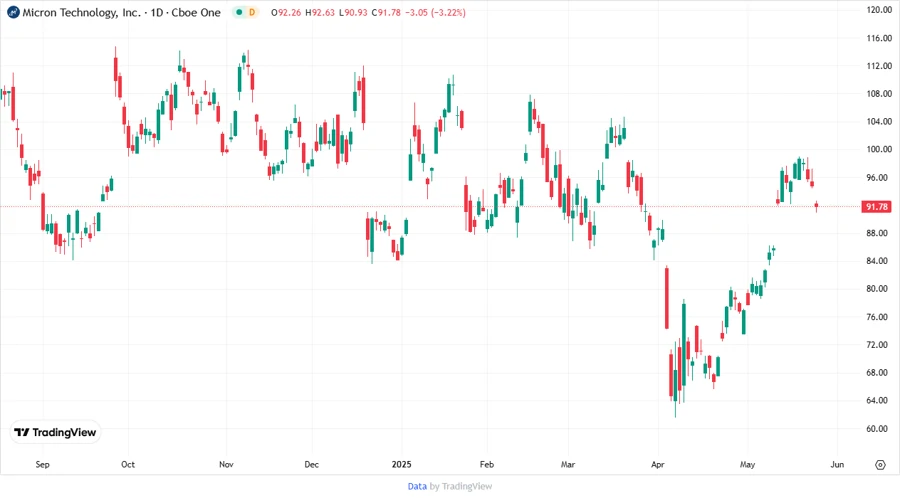
📉 Price Development
✅ Dividend Scoring System
| Category | Rating (1-5) | Score Representation |
|---|---|---|
| Dividend Yield | 3 | |
| Dividend Stability | 4 | |
| Dividend Growth | 4 | |
| Payout Ratio | 5 | |
| Financial Stability | 3 | |
| Dividend Continuity | 4 | |
| Cashflow Coverage | 3 | |
| Balance Sheet Quality | 4 |
Total Score: 30/40
🗣️ Rating
Micron Technology emerges as a solid consideration for dividend growth investors, highlighting a well-balanced profile of growth and stability traits. Despite recent market-induced challenges, its commitment to shareholder returns remains palpable, ensuring a favorable outlook for informed investors.
Smart Data Insight
Master the Perfect Entry & Exit for this Stock
Don't leave your profits to chance. Historically, this stock follows specific seasonal patterns that institutional traders use to maximize returns.
- ✅ Identify the "Golden Buying Window"
- ✅ Avoid high-risk correction cycles
- ✅ Backtested data from the last 20+ years