August 24, 2025 a 02:03 pm
MTCH: Trend and Support & Resistance Analysis - Match Group, Inc.
The stock of Match Group, Inc. has shown recent strength. With a diverse portfolio of dating brands, the company is well-positioned in the online dating market. Recent price action suggests potential bullish momentum, especially considering the rising EMAs. However, the stock remains sensitive to broader market trends and consumer technology shifts.
Trend Analysis
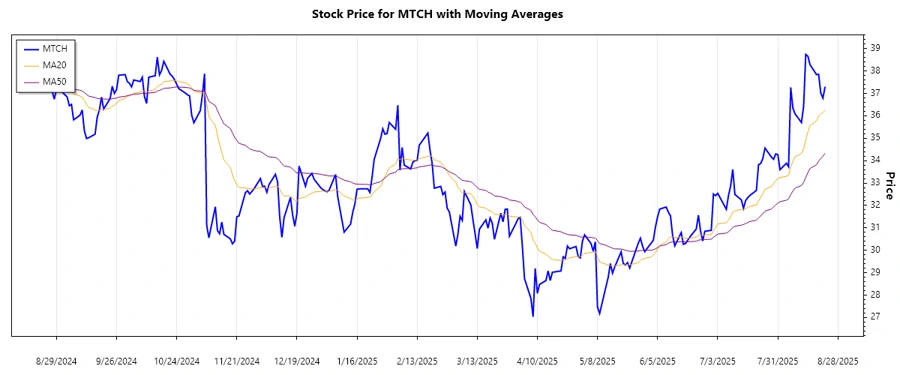
Based on the daily closing prices, we calculated the EMA20 and EMA50. Currently, EMA20 is slightly above EMA50, suggesting an ▲ Uptrend. Notably, recent days have seen prices consolidating upwards, indicating potential continued bullishness.
| Date | Closing Price | Trend |
|---|---|---|
| 2025-08-22 | 37.3 | ▲ |
| 2025-08-21 | 36.79 | ▲ |
| 2025-08-20 | 37.01 | ▲ |
| 2025-08-19 | 37.85 | ▲ |
| 2025-08-18 | 37.84 | ▲ |
| 2025-08-15 | 38.28 | ▲ |
| 2025-08-14 | 38.66 | ▲ |
Technical analysis indicates that the stock is currently on an upward trajectory, bolstered by positive crossovers of the EMAs.
Support- and Resistance
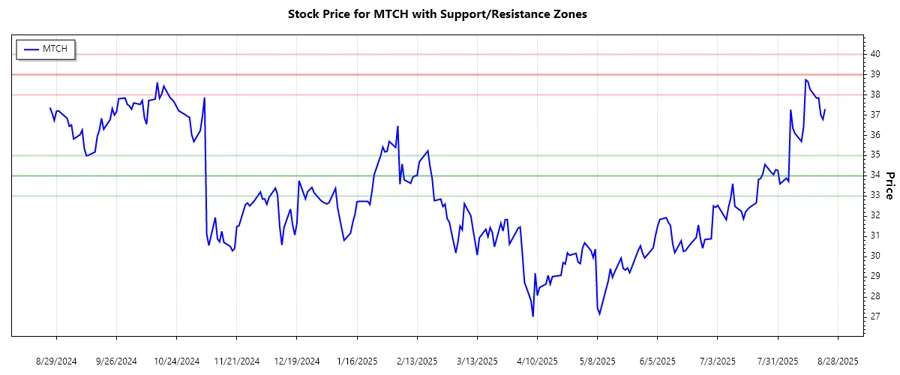
After analyzing the data, key support and resistance zones have been identified. The support zones are between $34.00 and $35.00, while resistance zones are at $38.00 to $39.00.
| Zone | Range |
|---|---|
| Support | 34.00 - 35.00 ▼ |
| Support | 33.00 - 34.00 ▼ |
| Resistance | 38.00 - 39.00 ▲ |
| Resistance | 39.00 - 40.00 ▲ |
The current price is close to the lower resistance zone, suggesting potential upward pressure in the near term.
Conclusion
In conclusion, Match Group, Inc. presents a lucrative opportunity given its bullish trend reinforced by EMA crossovers and approaching key resistance. However, attention should be placed on market sentiment shifts, which could affect the trend. The support zones offer a buffer, but the overall upward momentum is encouraging. For analysts, the current upward trend signals potential gains. Long-term success will depend on both market factors and the company's strategic decisions.
Smart Data Insight
Master the Perfect Entry & Exit for this Stock
Don't leave your profits to chance. Historically, this stock follows specific seasonal patterns that institutional traders use to maximize returns.
- ✅ Identify the "Golden Buying Window"
- ✅ Avoid high-risk correction cycles
- ✅ Backtested data from the last 20+ years