February 23, 2026 a 11:44 am

MTCH: Fibonacci Analysis - Match Group, Inc.
Match Group's stock has experienced significant fluctuations over the recent months. Despite challenges in the broader market, it has shown resilience, indicative of its strong brand portfolio. Our analysis will uncover the technical trends that could guide future stock movements.
Fibonacci Analysis
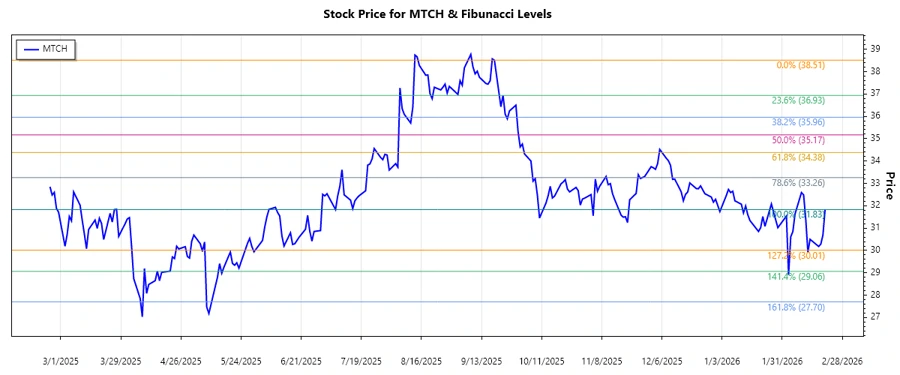
An analysis of recent stock data reveals a dominant downtrend for Match Group, Inc. from September 19, 2025, to February 20, 2026. Based on this trend, we've calculated key Fibonacci retracement levels:
| Parameter | Date | Price |
|---|---|---|
| Start of Trend | 2025-09-19 | 38.51 |
| End of Trend | 2026-02-20 | 31.83 |
| High Point | 2025-09-19 | 38.51 |
| Low Point | 2026-02-20 | 30.18 |
| Fibonacci Level | Price Level |
|---|---|
| 0.236 | 35.91 |
| 0.382 | 34.69 |
| 0.5 | 33.84 |
| 0.618 | 32.99 |
| 0.786 | 31.79 |
The current price is in the proximity of the 0.786 retracement level. This could indicate a potential support zone where the price may experience consolidation or reversal, providing possible buying opportunities.
This chart highlights the key levels of interest based on past performance.
Conclusion
As Match Group continues to navigate through market volatility, the retracement levels suggest potential support zones that could stabilize the price. Analysts should take into account the company's strong brand portfolio that underlies its resilience. However, external economic factors might still pose risks. Investors should consider both technical and fundamental aspects when making decisions, as ongoing market shifts could present both challenges and opportunities in the months ahead.