December 12, 2025 a 04:45 pm
MTCH: Fibonacci Analysis - Match Group, Inc.
Match Group, Inc. has been exhibiting a noteworthy downtrend over the past months, with recent price movements indicating a possible stabilization. The stock has faced challenges including competitive pressure and regulatory scrutiny impacting its growth outlook. Investors are keenly watching for signs of a turnaround as the company continues to focus on expanding its global brand presence.
Fibonacci Analysis
| Trend Analysis | Details |
|---|---|
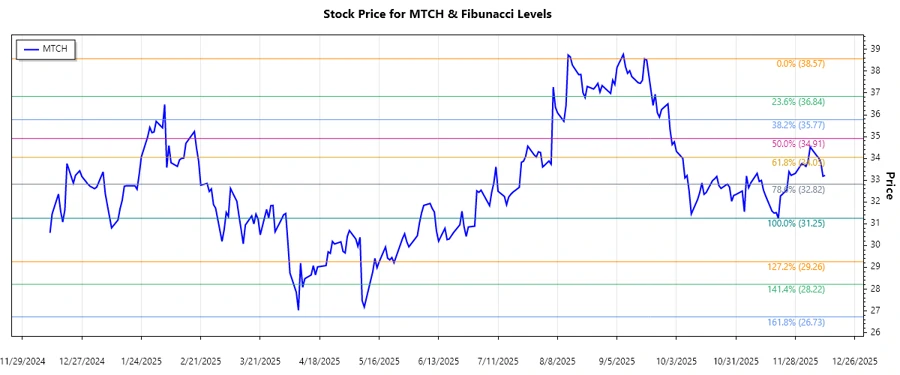
| Trend Start Date | 2025-09-19 |
| Trend End Date | 2025-12-12 |
| High Point | 38.57 (2025-09-18) |
| Low Point | 31.25 (2025-11-20) |
| Fibonacci Level | Price Level |
|---|---|
| 0.236 | 32.85 |
| 0.382 | 33.92 |
| 0.5 | 34.91 |
| 0.618 | 35.89 |
| 0.786 | 37.19 |
The current price of 33.215 is within the 0.236 retracement zone. This suggests that the stock may find potential support at this level, although further confirmation would be required for a definitive trend reversal.
Conclusion
Match Group, Inc. is currently navigating a challenging period marked by a downtrend. The Fibonacci retracement levels highlight several critical areas where the stock might encounter support. While the stock is within the 0.236 retracement level, a clear directional shift is necessary for sustained optimism. Investors are advised to monitor external market conditions and internal strategic maneuvers which could impact recovery potential. Downside risks continue to persist, but opportunities for long-term growth remain if the company leverages its extensive brand portfolio effectively. The analysis underscores the need for vigilance in assessing the stock's movements as it reacts to broader economic forces.