June 02, 2025 a 10:15 am

MTCH: Fibonacci Analysis - Match Group, Inc.
The Match Group, Inc., with its diverse portfolio of dating apps and services, recently exhibited signs of a mild bearish trend, reflecting broader market dynamics. The stock has experienced fluctuations, influenced by market sentiment and consumer behaviors. An insightful understanding of this can be gleaned through technical analysis, particularly Fibonacci retracements. This can help investors gauge potential support and resistance zones in the upcoming periods.
Fibonacci Analysis
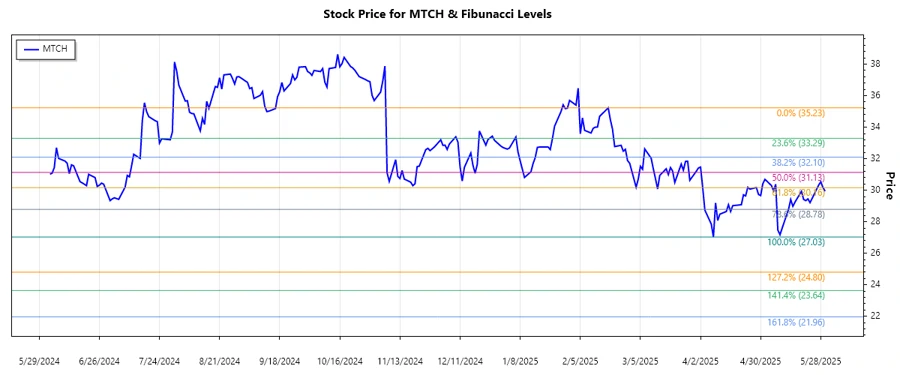
Based on the historical price data provided, Match Group, Inc. has demonstrated a dominant downtrend from February 18, 2025, to May 30, 2025. The price reached a high of $35.23 on February 18 and a low of $27.03 on April 8, capturing a significant bearish movement. The Fibonacci retracement analysis offers insight into key potential reversal levels.
| Detail | Value |
|---|---|
| Trend Duration | 2025-02-18 to 2025-05-30 |
| High Point | $35.23 on 2025-02-18 |
| Low Point | $27.03 on 2025-04-08 |
| Current Price | $29.94 on 2025-05-30 |
| Fibonacci Level 0.236 | $29.20 |
| Fibonacci Level 0.382 | $30.22 |
| Fibonacci Level 0.5 | $31.13 |
| Fibonacci Level 0.618 | $32.04 |
| Fibonacci Level 0.786 | $33.26 |
The current price of $29.94 is slightly above the 0.236 retracement level, indicating proximity to a potential support zone. If the price maintains above this level, it may signal a potential reversal or continuation within a consolidation phase.
Technically, such retracement levels serve as useful indicators for traders to identify potential support and resistance, adjusting strategies accordingly. The presence of the stock near these levels requires careful monitoring for confirmation of trend continuation or reversal.
Conclusion
The Match Group, Inc.'s stock remains in a bearish phase, yet current Fibonacci retracement levels suggest potential stabilizing zones. A further decline beyond the 0.236 level could expose it to further losses, while maintaining above this could allow for consolidation or a reversal attempt. Traders and investors may need to consider broader economic signals and company-specific developments to make informed decisions. The identified retracement levels provide a framework for assessing market reactions to ongoing price movements, emphasizing the importance of combining technical insight with fundamental analysis in stock evaluation.
Smart Data Insight
Master the Perfect Entry & Exit for this Stock
Don't leave your profits to chance. Historically, this stock follows specific seasonal patterns that institutional traders use to maximize returns.
- ✅ Identify the "Golden Buying Window"
- ✅ Avoid high-risk correction cycles
- ✅ Backtested data from the last 20+ years