April 26, 2025 a 11:31 am


MTCH: Dividend Analysis - Match Group, Inc.
Match Group, Inc. currently presents a limited dividend profile with no recent dividends being paid. Considering its growth trajectory and sector dynamics, the potential for future dividends remains contingent on improving financial stability and profitability. The company's strategic decisions will be crucial in ensuring dividends are reinstated.
📊 Overview
Match Group, Inc., categorized under the Technology sector, aims to reassess dividend strategies as part of its future financial planning.
| Sector | Dividend Yield | Current Dividend per Share | Dividend History | Last Cut or Suspension |
|---|---|---|---|---|
| Technology | 0.63% | 0 USD | 7 years | None |
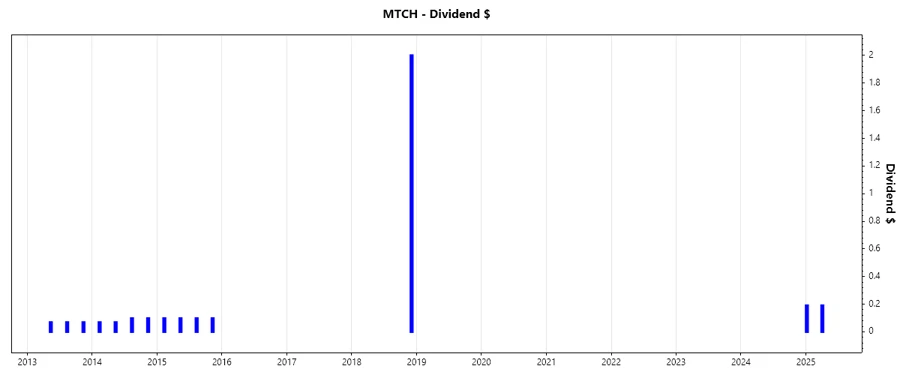
🗣️ Dividend History
Examining the dividend history of Match Group, Inc., we observe a lapse in consistent dividend payments. The company's past decisions to cut or suspend dividends reflect a tactical response to market conditions and operational priorities.
| Year | Dividend per Share (USD) |
|---|---|
| 2025 | 0.38 |
| 2018 | 2.00 |
| 2015 | 0.388 |
| 2014 | 0.331 |
| 2013 | 0.274 |
📈 Dividend Growth
Despite a seven-year dividend payment history, Match Group, Inc. reports no growth in dividend over specific periods. Reassessing business strategies can foster a more favorable growth outlook and enhance shareholder returns.
| Time | Growth |
|---|---|
| 3 years | 0% |
| 5 years | 0% |
The average dividend growth is 0% over 5 years. This reveals a need for strategic revamping to achieve sustainable growth.
📉 Payout Ratio
The payout ratio is a significant metric for evaluating how comfortably a company can pay dividends. Match Group, Inc. currently shows 0% for both EPS and Free Cash Flow metrics, indicative of either strategic dividend suspension or reinvestment practices.
| Key Figure | Ratio |
|---|---|
| EPS-based | 0% |
| FCF-based | 0% |
✅ Cashflow & Capital Efficiency
The efficient management of cash flows and capital is crucial to sustain operational growth and capital returns. Assessing these fundamentals aids in evaluating Match Group, Inc.'s ability to maintain liquidity while investing in growth opportunities.
| Metric | 2022 | 2023 | 2024 |
|---|---|---|---|
| Free Cash Flow Yield | 4.06% | 8.24% | 0.00% |
| Earnings Yield | 3.09% | 6.47% | 6.18% |
| CAPEX to Operating Cash Flow | 9.34% | 7.52% | 0.00% |
| Stock-based Compensation to Revenue | 6.39% | 6.90% | 7.58% |
| Free Cash Flow/Operating Cash Flow Ratio | 90.65% | 92.48% | 0.00% |
These figures reflect the need for optimizing capital allocation and reducing dependency on non-operating earnings.
📈 Balance Sheet & Leverage Analysis
Analyzing leverage metrics alongside debt ratios gives insight into Match Group's financial solvency and risk exposure.
| Metric | 2022 | 2023 | 2024 |
|---|---|---|---|
| Debt-to-Equity | -10.66 | -202.43 | -61.81 |
| Debt-to-Assets | 91.70% | 87.78% | 88.11% |
| Debt-to-Capital | 110.35% | 100.50% | 101.64% |
| Net Debt to EBITDA | 4.92 | 2.96 | 3.61 |
| Current Ratio | 1.59 | 2.39 | 2.54 |
| Quick Ratio | 1.59 | 2.39 | 2.54 |
| Financial Leverage | -11.62 | -230.61 | -70.15 |
These leverage ratios suggest high debt levels relative to equity, indicating potential insolvency concerns that may affect future dividend policies.
📊 Fundamental Strength & Profitability
Comprehending Match Group's profitability illustrates its capacity to generate returns over its asset and equity base, contributing to the strength of its financial profile.
| Metric | 2022 | 2023 | 2024 |
|---|---|---|---|
| Return on Equity | -1.01% | -33.33% | -8.66% |
| Return on Assets | 8.65% | 14.45% | 12.34% |
| Net Profit Margin | 11.35% | 19.37% | 15.84% |
| EBIT Margin | 16.40% | 27.84% | 23.66% |
| EBITDA Margin | 20.78% | 31.10% | 23.66% |
| Gross Margin | 69.90% | 71.64% | 71.51% |
| R&D to Revenue | 10.46% | 11.42% | 12.71% |
The negative Return on Equity is alarming and reflects inefficiencies in generating profits from the equity base, possibly discouraging future dividend distributions.
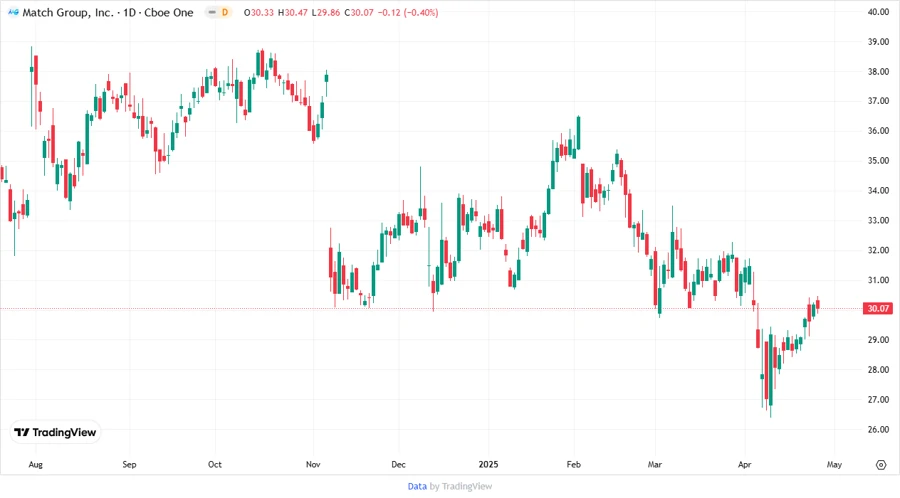
📈 Price Development
📊 Dividend Scoring System
| Category | Description | Score |
|---|---|---|
| Dividend Yield | Reflects the return as dividends | |
| Dividend Stability | Steadiness in paying dividends over time | |
| Dividend Growth | Incremental rise in dividends | |
| Payout Ratio | Percentage of earnings paid as dividends | |
| Financial Stability | Overall financial health and risk profile | |
| Dividend Continuity | Uninterrupted distributions | |
| Cashflow Coverage | Ability to cover dividends with cash flow | |
| Balance Sheet Quality | Strength of assets relative to liabilities |
Total Score: 13 / 40
✅ Rating
Based on the comprehensive dividend analysis and scoring, Match Group, Inc. currently falls in the low-dividend category concerning yield, stability, and growth potential. A cautious investment approach is advised, focusing on potential market and operational shifts which may enhance future dividend prospects.
Smart Data Insight
Master the Perfect Entry & Exit for this Stock
Don't leave your profits to chance. Historically, this stock follows specific seasonal patterns that institutional traders use to maximize returns.
- ✅ Identify the "Golden Buying Window"
- ✅ Avoid high-risk correction cycles
- ✅ Backtested data from the last 20+ years