May 11, 2026 a 08:15 am
MTB: Trend and Support & Resistance Analysis - M&T Bank Corporation
M&T Bank Corporation, a massive entity in the banking sector, has shown a significant breadth of services from commercial to retail banking. With a diversified portfolio, the company's financial performance and stock trajectory are closely watched by analysts. The recent market data shows nuanced movements that can inform investment decisions. Let's delve into the trend and support & resistance levels for a comprehensive understanding.
Trend Analysis
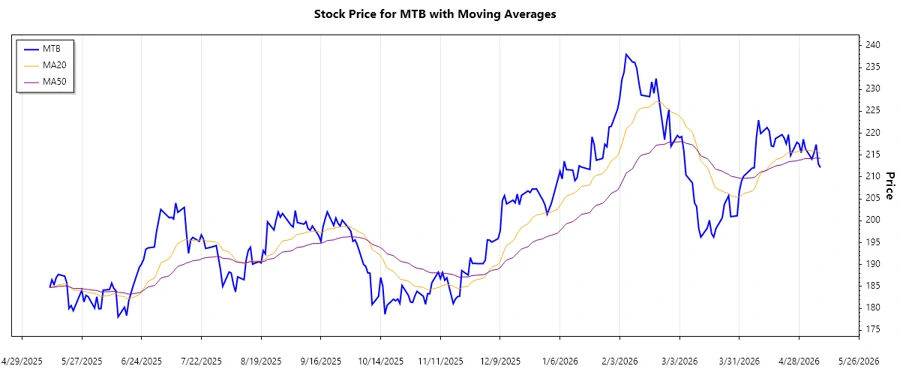
By analyzing the recent price movements of MTB's stock, we identify that the stock price has seen some fluctuations with an overall varied historical performance. Calculating the Exponential Moving Averages (EMA) over the data:
- EMA20: The more sensitive short-term indicator.
- EMA50: A longer-term, smoother average line.
Over the last periods, the calculated EMAs suggest a trend direction based on the comparison between EMA20 and EMA50:
| Date | Close Price | Trend |
|---|---|---|
| 2026-05-08 | 212.14 | ▼ Down |
| 2026-05-07 | 213.02 | ▼ Down |
| 2026-05-06 | 217.42 | ▼ Down |
| 2026-05-05 | 215.48 | ▼ Down |
| 2026-05-04 | 214.08 | ▼ Down |
| 2026-05-01 | 216.44 | ▼ Down |
| 2026-04-30 | 218.63 | ⚖️ Sideways |
The trend analysis reflects a declining movement over the recent days, suggesting potential bearish sentiment among investors.
Support and Resistance
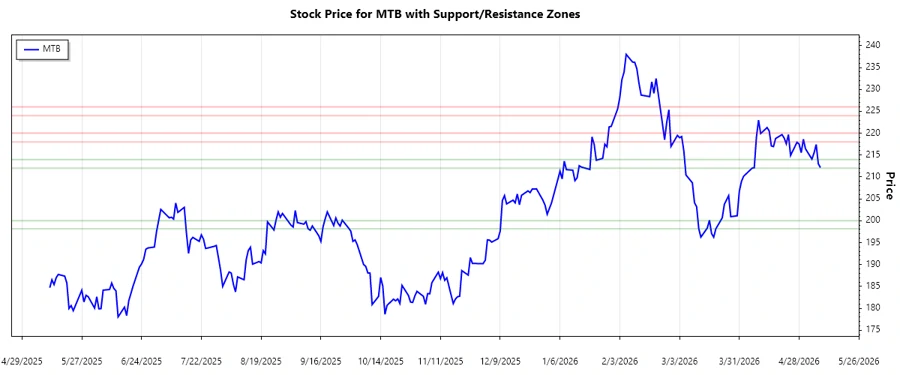
In order to determine potential entry and exit points, identifying support and resistance zones is crucial. Analyzing the recent price data, we established the following zones:
| Zone Type | From | To |
|---|---|---|
| Support 1 | 198.15 | 200.00 |
| Support 2 | 212.00 | 214.00 |
| Resistance 1 | 218.00 | 220.00 |
| Resistance 2 | 224.00 | 226.00 |
The current stock price is navigating near the second support zone, suggesting possible resilience at these levels. Breaking below could indicate further downside potential, whereas a rebound might target the resistance zones.
Conclusion
The M&T Bank Corporation stock has recently shown a declining trend, with EMA indicators suggesting bearish sentiment. By identifying key support and resistance zones, investors are guided towards strategically timed decisions. The intersection of current prices within these zones underscores their potential importance as pivot points. Without dismissing inherent financial risks, these analyses are invaluable for investors seeking informed entries or exits amid market volatility. Continuing to monitor broader economic factors alongside intrinsic indicators will be crucial for comprehensive investment strategies.
Smart Data Insight
Master the Perfect Entry & Exit for this Stock
Don't leave your profits to chance. Historically, this stock follows specific seasonal patterns that institutional traders use to maximize returns.
- ✅ Identify the "Golden Buying Window"
- ✅ Avoid high-risk correction cycles
- ✅ Backtested data from the last 20+ years