October 14, 2025 a 08:15 am**MTB: Trend and Support & Resistance Analysis - M&T Bank Corporation**
 **Trend Analysis**

The M&T Bank Corporation stock has shown both resilience and volatility in recent months. With dynamic movements influenced by broader economic indicators, investors should consider both short-term market reactions and the bank's longstanding stability. The calculated EMA trends provide deeper insights into potential future price directions. Understanding support and resistance zones becomes crucial for making informed investment decisions in the evolving financial landscape.
Trend Analysis
The analysis of M&T Bank Corporation's stock reveals significant market movements influenced by broader financial trends. Calculating the EMA20 and EMA50 provides insights into short-term to medium-term trends. Based on the data, we observe the following for MTB:
| Date | Closing Price | Trend |
|---|---|---|
| 2025-10-13 | 182.7 | ▼ Abwärtstrend |
| 2025-10-10 | 180.84 | ▼ Abwärtstrend |
| 2025-10-09 | 188.04 | ▼ Abwärtstrend |
| 2025-10-08 | 188.07 | ▼ Abwärtstrend |
| 2025-10-07 | 189.58 | ▼ Abwärtstrend |
| 2025-10-06 | 190 | ▼ Abwärtstrend |
| 2025-10-03 | 194.56 | ▼ Abwärtstrend |
The calculated EMAs indicate that the stock is currently experiencing a downward trend. The current EMA20 is below the EMA50, suggesting further potential decline in the short term.
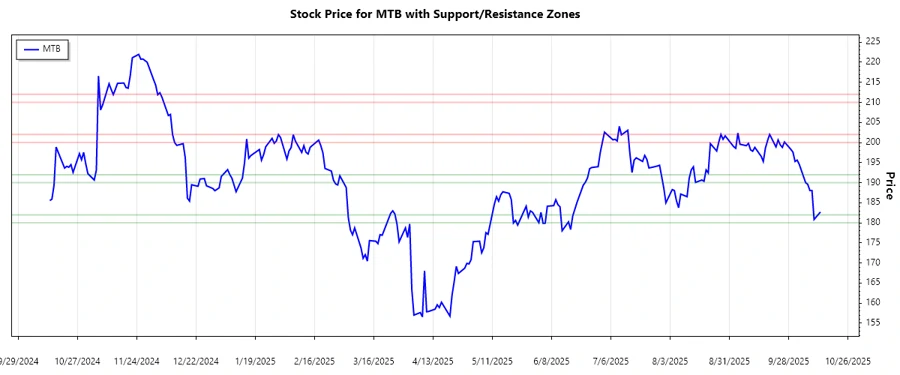
Support and Resistance Analysis
In examining the support and resistance levels of M&T Bank Corporation's stock, several key zones have been identified based on the closing prices analyzed:
| Zone Type | From | To |
|---|---|---|
| Support Zone 1 | 180 | 182 |
| Support Zone 2 | 190 | 192 |
| Resistance Zone 1 | 200 | 202 |
| Resistance Zone 2 | 210 | 212 |
Currently, the stock price appears to be approaching the Support Zone 1, hinting at a potential bounce-back opportunity if buying demand increases. The narrow proximity to resistance zones indicates continuous selling pressure at higher prices.
Conclusion
In summary, M&T Bank Corporation's stock is experiencing downward pressure in the face of broader market trends. This bearish trend is highlighted by the EMA analysis, with the EMA20 positioned below the EMA50. The identified support and resistance levels provide critical benchmarks for pricing behavior. Investors should remain vigilant of the support zones for potential entry points. Meanwhile, overcoming resistance levels will signal a reversal trend, highlighting improved market sentiment. As market dynamics evolve, continuous monitoring is advised to capitalize on emerging opportunities while mitigating risks.
Smart Data Insight
Master the Perfect Entry & Exit for this Stock
Don't leave your profits to chance. Historically, this stock follows specific seasonal patterns that institutional traders use to maximize returns.
- ✅ Identify the "Golden Buying Window"
- ✅ Avoid high-risk correction cycles
- ✅ Backtested data from the last 20+ years