July 14, 2025 a 02:03 pm
MSI: Trend and Support & Resistance Analysis - Motorola Solutions, Inc.
Motorola Solutions, Inc., operating in mission-critical communications and analytics globally, has seen a dynamic movement in its stock price. With ongoing demands in public safety and communications, the company is positioned well in the market. However, its performance can be subject to market fluctuations influenced by global economic conditions. Recent trends indicate potential areas of support and resistance, crucial for investors looking to make informed decisions.
Trend Analysis
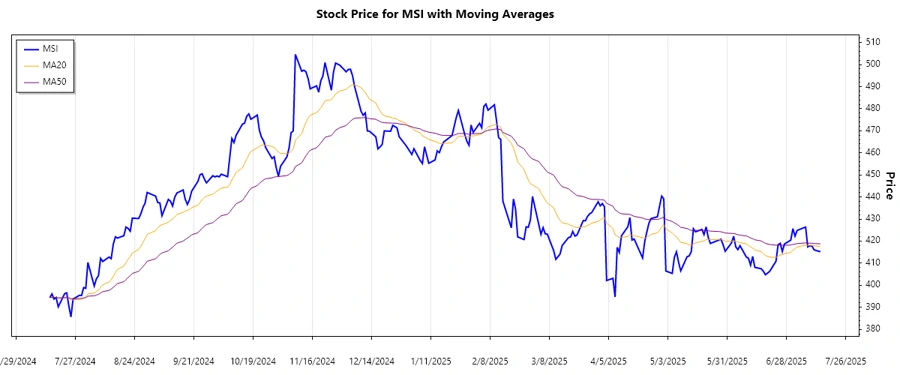
The stock price for Motorola Solutions, Inc. has shown varied performance in recent months. By calculating the EMA20 and EMA50, we determine the prevalent trend as follows:
| Date | Closing Price | Trend |
|---|---|---|
| 2025-07-14 | $415.17 | ⭡ |
| 2025-07-11 | $416.03 | ⭢ |
| 2025-07-10 | $417.72 | ⭡ |
| 2025-07-09 | $417.88 | ⭢ |
| 2025-07-08 | $417.36 | ⭡ |
| 2025-07-07 | $426.37 | ⭡ |
| 2025-07-03 | $424.84 | ⭢ |
The trend shows signs of a moderate upward trend in recent days, suggesting investor confidence. Understanding this dynamic can offer strategic opportunities for timely investments.
Support and Resistance
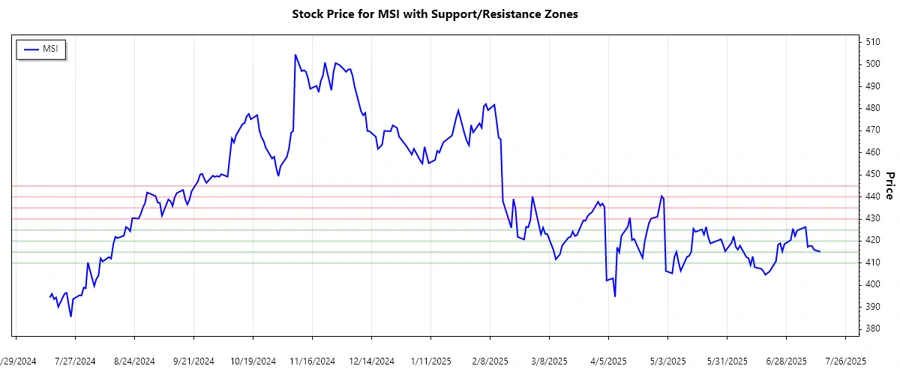
Identifying key support and resistance zones provides insight into possible price momentum.
| Zone | Price Range | Direction |
|---|---|---|
| Support Zone 1 | $410.00 - $415.00 | ⭣ |
| Support Zone 2 | $420.00 - $425.00 | ⭢ |
| Resistance Zone 1 | $430.00 - $435.00 | ⭡ |
| Resistance Zone 2 | $440.00 - $445.00 | ⭡ |
Currently, the price hovers between the second support and first resistance zone, which may act as a buffer for upward or downward movement. Monitoring these zones can help in predicting market behavior.
Conclusion
Motorola Solutions, Inc. shows a stable upward trend with firm support zones, suggesting a potential for appreciation. However, it faces resistance that needs to be monitored closely. If market conditions remain favorable, the stock could breach resistance zones. Investors should keep an eye on both technical and fundamental aspects to optimize their investment strategy.
Smart Data Insight
Master the Perfect Entry & Exit for this Stock
Don't leave your profits to chance. Historically, this stock follows specific seasonal patterns that institutional traders use to maximize returns.
- ✅ Identify the "Golden Buying Window"
- ✅ Avoid high-risk correction cycles
- ✅ Backtested data from the last 20+ years