April 22, 2026 a 07:43 pm

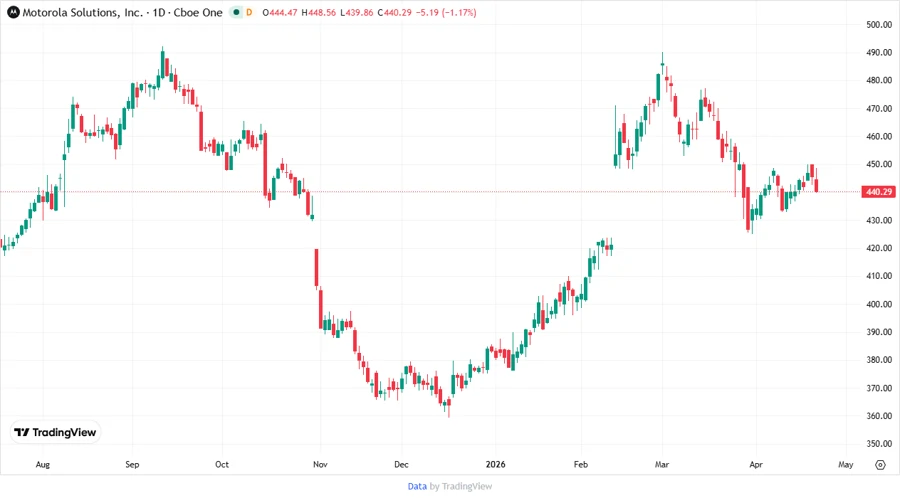
MSI: Fundamental Ratio Analysis - Motorola Solutions, Inc.
Motorola Solutions, Inc. demonstrates a robust market presence with its technology-centric operations, servicing critical communications and analytical demands globally. With a stable revenue stream from government and commercial customers, it promises steady growth. However, investors must carefully weigh industry competition and technological disruptions.
Fundamental Rating
Motorola Solutions presents a balanced outlook with strengths in return metrics and opportunities for growth in cash flow utilization.
| Category | Score | Visual |
|---|---|---|
| Discounted Cash Flow | 3 | |
| Return on Equity | 5 | |
| Return on Assets | 5 | |
| Debt to Equity | 1 | |
| Price to Earnings | 2 | |
| Price to Book | 1 |
Historical Rating
Stability over time shown in the scores, highlighting continuous operational strengths with areas for improved valuation.
| Date | Overall | DCF | ROE | ROA | D/E | P/E | P/B |
|---|---|---|---|---|---|---|---|
| 2026-04-22 | 3 | 3 | 5 | 5 | 1 | 2 | 1 |
| N/A | 0 | 3 | 5 | 5 | 1 | 2 | 1 |
Analyst Price Targets
Analyst estimates showcase potential upside with current stock value under median target, indicating potential growth room.
| High | Low | Median | Consensus |
|---|---|---|---|
| $506 | $450 | $484.5 | $481.25 |
Analyst Sentiment
Analysts' consensus resides in a positive light for Motorola Solutions, with a predominant lean towards buying strength.
| Recommendation | Count | Visual |
|---|---|---|
| Strong Buy | 0 | |
| Buy | 23 | |
| Hold | 6 | |
| Sell | 4 | |
| Strong Sell | 0 |
Conclusion
Motorola Solutions, Inc., with its critical communications services, offers promising investment value bolstered by steady governmental contracts. Despite minor valuation challenges, its strong historical performance and buy-oriented analyst sentiment accentuate growth potential. However, prudent consideration of potential macroeconomic shifts and tech innovation impacts remains essential. The mixed ratings suggest a strategic outlook for long-term investment over immediate gains.
Smart Data Insight
Master the Perfect Entry & Exit for this Stock
Don't leave your profits to chance. Historically, this stock follows specific seasonal patterns that institutional traders use to maximize returns.
- ✅ Identify the "Golden Buying Window"
- ✅ Avoid high-risk correction cycles
- ✅ Backtested data from the last 20+ years