August 25, 2025 a 03:15 pm
MSI: Fibonacci Analysis - Motorola Solutions, Inc.
Motorola Solutions, Inc., operating across global markets, presents a robust mix of products and services in critical communications and analytics. Despite facing competitive pressures, the company's expertise in land mobile radio communications and video security is pivotal for serving government and public safety sectors. Recent stock performance reflects these strengths, but market volatility necessitates cautious optimism for investors.
Fibonacci Analysis
| Attribute | Value |
|---|---|
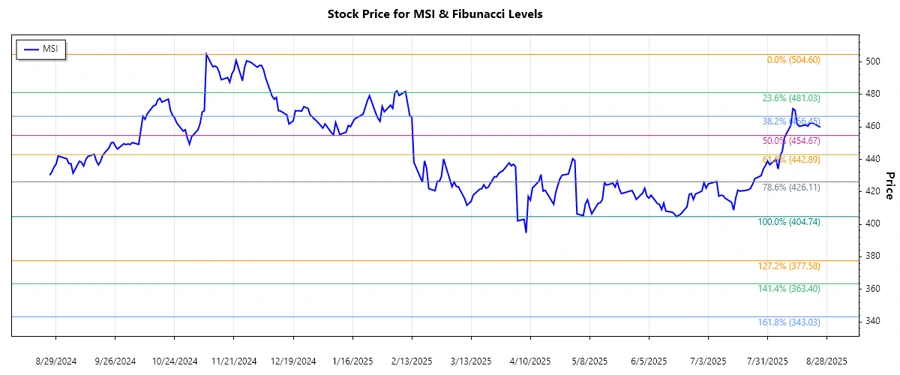
| Trend Start Date | 2024-11-08 |
| Trend End Date | 2025-06-17 |
| High Price (Date) | 504.60 (2024-11-08) |
| Low Price (Date) | 404.74 (2025-06-18) |
| Fibonacci Level | Price |
|---|---|
| 0.236 | 426.85 |
| 0.382 | 442.20 |
| 0.5 | 454.67 |
| 0.618 | 467.14 |
| 0.786 | 484.12 |
The current price of 459.76 is in the retracement zone of 0.5, indicating potential support levels. This suggests a possible price consolidation around this level, potentially leading to a support level in a bullish market scenario.
Conclusion
Motorola Solutions, Inc. shows a generally positive outlook with their critical communication and analytics services positioned for sustained demand. While facing industry challenges, the company's diversified portfolio offers resilience against market fluctuations. Current technical analysis suggests potential price stability, providing a balanced risk-reward for investors. However, market volatility and external factors such as regulatory changes or technological disruptions may impact future performance. Analysts should watch for strategic initiatives and market changes that could influence the price trajectory.
Smart Data Insight
Master the Perfect Entry & Exit for this Stock
Don't leave your profits to chance. Historically, this stock follows specific seasonal patterns that institutional traders use to maximize returns.
- ✅ Identify the "Golden Buying Window"
- ✅ Avoid high-risk correction cycles
- ✅ Backtested data from the last 20+ years