June 14, 2025 a 03:15 pm
MSI: Fibonacci Analysis - Motorola Solutions, Inc.
Motorola Solutions, Inc. has demonstrated resilience in the face of market volatility, maintaining robust communications and security offerings. While the stock has seen corrections, it shows potential for recovery, especially with increasing demand for integrated communication systems and security solutions. Investors may find opportunities in its valuation, given the potential for business expansion and enhanced service offerings globally.
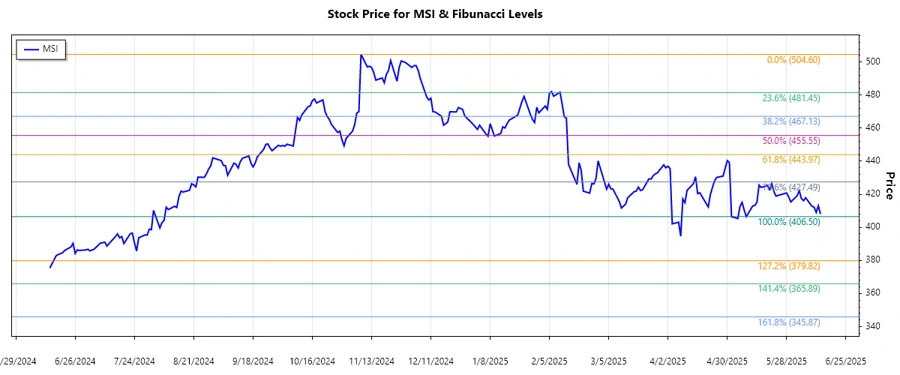
Fibonacci Analysis
| Parameter | Value |
|---|---|
| Trend Start Date | 2024-12-11 |
| Trend End Date | 2025-06-13 |
| High Point (Price/Date) | $504.6 / 2024-11-08 |
| Low Point (Price/Date) | $406.5 / 2025-05-09 |
| Fibonacci 0.236 | $428.94 |
| Fibonacci 0.382 | $446.67 |
| Fibonacci 0.5 | $455.55 |
| Fibonacci 0.618 | $463.85 |
| Fibonacci 0.786 | $481.10 |
| Current Price Level | $408.1 |
| Retracement Zone | None |
| Interpretation | Currently trading below the Fibonacci retracement zones, suggesting potential resistance at higher levels. |
Conclusion
Motorola Solutions, Inc. has seen a declining trend from its peak in late 2024 to current levels. The stock remains outside significant Fibonacci retracement zones, suggesting a challenge for the price to break above resistance levels defined by these ratios. Investors should monitor the $446.67 and $455.55 areas for potential breakout indications. The company's broad portfolio and continued demand in communications and security offer long-term growth potential, but current technicals indicate caution. Future movements may be influenced by broader market trends and company-specific news, such as contracts or technology innovation.
Smart Data Insight
Master the Perfect Entry & Exit for this Stock
Don't leave your profits to chance. Historically, this stock follows specific seasonal patterns that institutional traders use to maximize returns.
- ✅ Identify the "Golden Buying Window"
- ✅ Avoid high-risk correction cycles
- ✅ Backtested data from the last 20+ years