January 05, 2026 a 03:32 pm
MSI: Dividend Analysis - Motorola Solutions, Inc.
Motorola Solutions, Inc. presents a compelling case for dividend investors with its strong track record of 54 consecutive years of dividend payments. The current dividend yield is modest at 1.23%, but consistent growth and strategic financial management indicate potential for long-term shareholder returns. Investors should note the corporation's solid payout ratios, reflecting a well-managed dividend policy.
📊 Overview
Motorola Solutions operates in the tech industry, characterized by its steady dividend yield of 1.23%. With a current dividend per share of $3.92, the company boasts an impressive 54-year streak of unbroken dividends, overcoming its last cut back in 2011.
| Metric | Value |
|---|---|
| Sector | Technology |
| Dividend yield | 1.23% |
| Current dividend per share | $3.92 |
| Dividend history | 54 years |
| Last cut or suspension | 2011 |
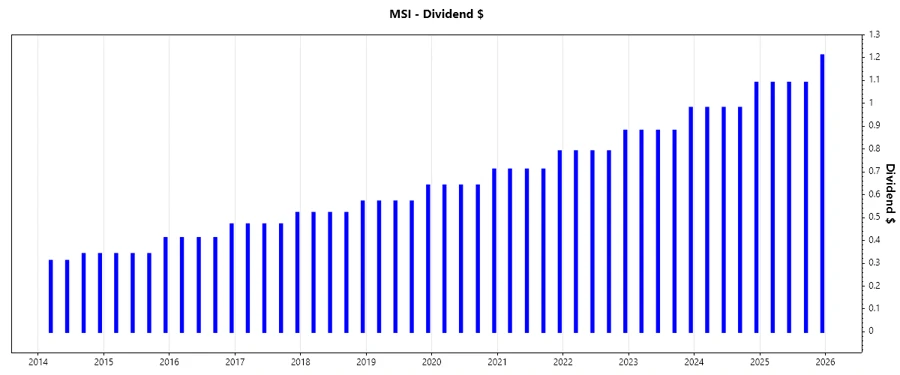
🗣️ Dividend History
The long history of consistent dividends underlines Motorola's commitment to returning value to shareholders. Such stability is a hallmark of a reliable income source for investors.
| Year | Dividend Per Share (USD) |
|---|---|
| 2025 | 4.48 |
| 2024 | 4.03 |
| 2023 | 3.62 |
| 2022 | 3.25 |
| 2021 | 2.92 |
📈 Dividend Growth
Tracking growth is essential for assessing the viability of future dividend income. Motorola's growth demonstrates resilience and strategic resource allocation.
| Time | Growth |
|---|---|
| 3 years | 11.29% |
| 5 years | 11.24% |
The average dividend growth is 11.24% over 5 years. This shows moderate but steady dividend growth.
📉 Payout Ratio
The payout ratio provides insight into how sustainably the company can continue paying dividends. Lower ratios suggest room for future growth in payouts.
| Key Figure | Ratio |
|---|---|
| EPS-based | 30.87% |
| Free cash flow-based | 27.05% |
The EPS payout ratio of 30.87% and FCF payout ratio of 27.05% indicate a balanced approach, maintaining dividend commitments while ensuring financial flexibility.
✅ Cashflow & Capital Efficiency
These metrics are crucial for evaluating the underlying financial health of the company. Sustainable free cash flow supports dividends and growth investments.
| Fiscal Year | 2024 | 2023 | 2022 |
|---|---|---|---|
| Free Cash Flow Yield | 2.77% | 3.43% | 3.63% |
| Earnings Yield | 2.05% | 3.27% | 3.16% |
| CAPEX to Operating Cash Flow | 10.75% | 12.38% | 14.04% |
| Stock-based Compensation to Revenue | 2.25% | 2.12% | 1.89% |
| Free Cash Flow / Operating Cash Flow Ratio | 89.25% | 87.62% | 85.96% |
Motorola's robust cash flow generation provides stability to dividend payments, while capital efficiency ensures the prudent use of investor funds, reflected in the strong return on invested capital.
⚠️ Balance Sheet & Leverage Analysis
The balance sheet strength is vital in assessing the firm's capacity to handle debt while maintaining liquidity for operations and investments.
| Fiscal Year | 2024 | 2023 | 2022 |
|---|---|---|---|
| Debt-to-Equity | 384.67% | 904.70% | 5647% |
| Debt-to-Assets | 44.89% | 49.12% | 51.12% |
| Debt-to-Capital | 79.37% | 90.05% | 98.26% |
| Net Debt to EBITDA | 2.63 | 1.76 | 2.38 |
| Current Ratio | 1.28 | 0.998 | 1.15 |
| Quick Ratio | 1.13 | 0.85 | 0.92 |
| Financial Leverage | 8.57 | 18.42 | 110.47 |
Motorola’s substantial leverage is effectively managed, given its consistent interest coverage ratios, underscoring the operational capacity to manage its debt obligations.
✅ Fundamental Strength & Profitability
Profitability ratios help investors gauge the efficiency with which a company can convert revenue into profit.
| Fiscal Year | 2024 | 2023 | 2022 |
|---|---|---|---|
| Return on Equity | 92.60% | 236.05% | 1175% |
| Return on Assets | 10.81% | 12.81% | 10.64% |
| Net Margin | 14.58% | 17.13% | 14.96% |
| EBIT Margin | 20.96% | 24.00% | 19.26% |
| EBITDA Margin | 24.06% | 27.57% | 24.09% |
| Gross Margin | 50.96% | 49.81% | 46.41% |
| R&D to Revenue | 8.48% | 8.60% | 8.55% |
Motorola demonstrates solid profitability, supported by healthy margins across the board and competitive returns on both equity and invested capital.
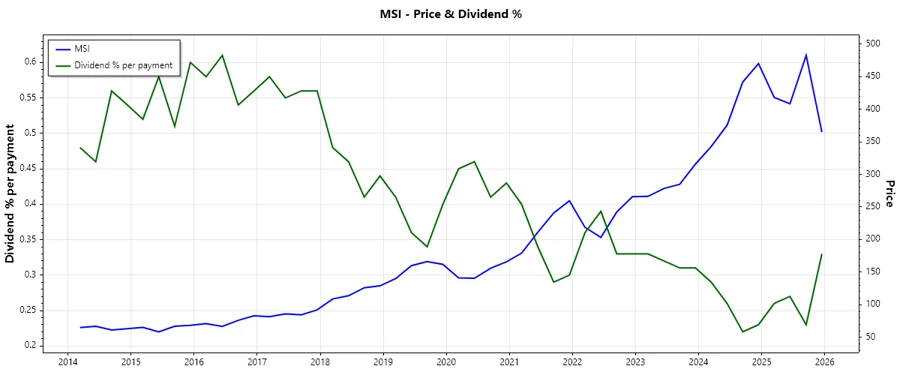
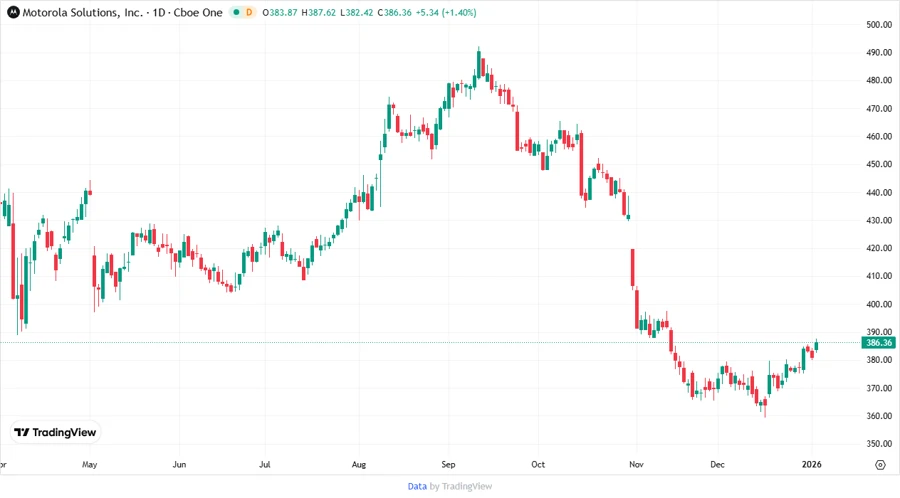
📈 Price Development
📈 Dividend Scoring System
| Category | Score (Out of 5) | Description |
|---|---|---|
| Dividend yield | 3 | |
| Dividend Stability | 5 | |
| Dividend growth | 4 | |
| Payout ratio | 4 | |
| Financial stability | 3 | |
| Dividend continuity | 5 | |
| Cashflow Coverage | 4 | |
| Balance Sheet Quality | 3 |
Total Score: 31/40
✅ Rating
In summary, Motorola Solutions, Inc. offers a reliable dividend picture with a strong history of payments and steady growth. While the dividend yield is not exceptionally high, its stability and the company's solid financial ratios make it a considerable choice for dividend growth investors.