December 18, 2025 a 03:31 pm

MSI: Dividend Analysis - Motorola Solutions, Inc.
Motorola Solutions, Inc., a stalwart in its sector, has a storied dividend history spanning 54 years with significant growth over the past decade. The company's current strategies highlight a dedication to returning capital to shareholders, evidenced by a consistent dividend yield and moderate payout ratios. With a history of only one recent cut in 2011, the company's dividends appear relatively safe for investors seeking stability.
📊 Overview
Motorola Solutions operates within a dynamic sector, consistently yielding dividends that have been bolstered by substantial annual increases. The company's resilience through challenging markets is underscored by a low payout ratio, suggesting a sustainable dividend strategy.
| Metric | Details |
|---|---|
| Sector | Commercial Services & Supplies |
| Dividend yield | 1.23 % |
| Current dividend per share | 3.92 USD |
| Dividend history | 54 years |
| Last cut or suspension | 2011 |
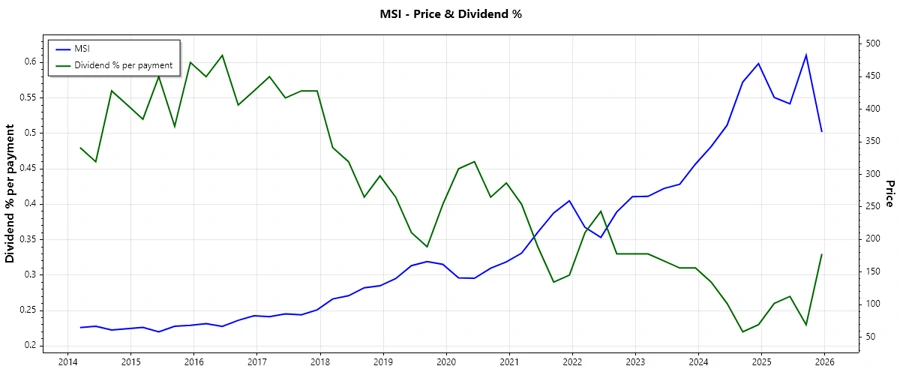
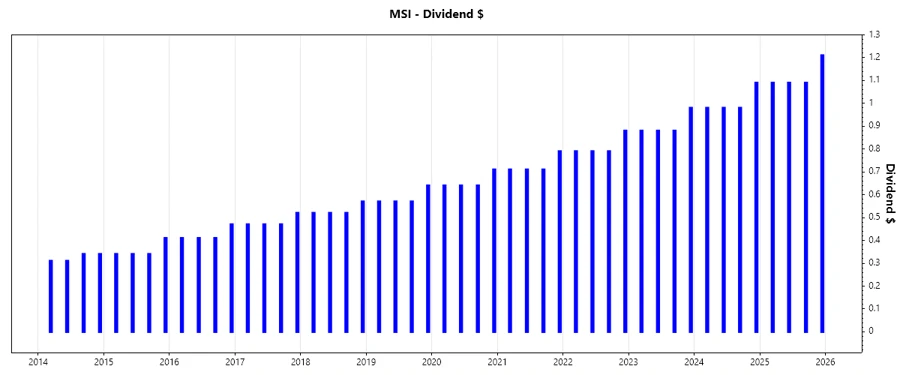
🗣️ Dividend History
An impeccable dividend history of over 54 years reflects the company's commitment to rewarding its shareholders. Such consistency is pivotal for investors valuing stable income over time.
| Year | Dividend per Share (USD) |
|---|---|
| 2025 | 4.48 |
| 2024 | 4.03 |
| 2023 | 3.62 |
| 2022 | 3.25 |
| 2021 | 2.92 |
📈 Dividend Growth
The growth trajectory of dividends underscores the company's robust financial health and shareholder commitment. Analyzing recent trends is instrumental for understanding both immediate financial policy and strategic foresight.
| Time | Growth |
|---|---|
| 3 years | 11.34 % |
| 5 years | 11.39 % |
The average dividend growth is 11.39 % over 5 years. This shows moderate but steady dividend growth.
Payout Ratio
Payout ratios play a critical role in assessing the financial integrity of dividend policies. Lower ratios often indicate room for growth, implying a safeguarding of future dividend security.
| Key figure | Ratio |
|---|---|
| EPS-based | 30.87 % |
| Free cash flow-based | 27.05 % |
The EPS payout ratio of 30.87 % suggests a disciplined approach, while a 27.05 % FCF-based payout ratio further underscores dividend sustainability.
Cashflow & Capital Efficiency
Vital indicators like cash flow and operational efficiency can illuminate a company's ability to fund dividends without compromising its capital structure.
| Metric | 2022 | 2023 | 2024 |
|---|---|---|---|
| Free Cash Flow Yield | 3.63 % | 3.43 % | 2.77 % |
| Earnings Yield | 3.16 % | 3.27 % | 2.05 % |
| CAPEX to Operating Cash Flow | 14.04 % | 12.38 % | 10.75 % |
| Stock-based Compensation to Revenue | 1.89 % | 2.12 % | 2.25 % |
| Free Cash Flow / Operating Cash Flow Ratio | 85.96 % | 87.62 % | 89.25 % |
Capital returns remain substantial, although metrics indicate a declining trend in free cash flow yield, warranting investor vigilance on operational profitability.
Balance Sheet & Leverage Analysis
Thorough balance sheet inspection aids in understanding financial stability and benchmarking debt obligations against capital adequacy.
| Metric | 2022 | 2023 | 2024 |
|---|---|---|---|
| Debt-to-Equity | 56.47 | 9.05 | 3.85 |
| Debt-to-Assets | 0.51 | 0.49 | 0.45 |
| Debt-to-Capital | 0.98 | 0.90 | 0.79 |
| Net Debt to EBITDA | 2.38 | 1.76 | 1.71 |
| Current Ratio | 1.15 | 0.99 | 1.01 |
| Quick Ratio | 0.92 | 0.85 | 1.13 |
Leverage metrics indicate controlled reductions and sound liquidity with adequate ratios, maintaining sustainable debt servicing potential.
Fundamental Strength & Profitability
Fundamentals are foundational to financial evaluation and present insights into a company’s profitability and overall financial health.
| Metric | 2022 | 2023 | 2024 |
|---|---|---|---|
| Return on Equity | 11.75 % | 236.05 % | 92.60 % |
| Return on Assets | 10.64 % | 12.81 % | 10.81 % |
| Net Margin | 14.96 % | 17.13 % | 14.57 % |
| EBIT Margin | 19.26 % | 24.00 % | 20.96 % |
| Research & Development to Revenue | 8.55 % | 8.60 % | 8.48 % |
High return on equity and efficient resource allocation across years point to effective revenue utilization and profitability augmentation.
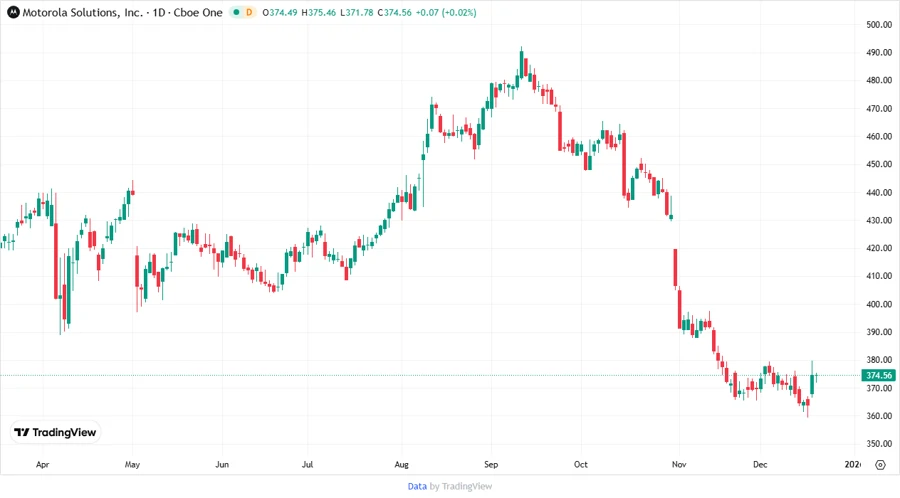
Price Development
Dividend Scoring System
| Criteria | Score | Evaluation |
|---|---|---|
| Dividend yield | 4 | |
| Dividend Stability | 5 | |
| Dividend growth | 4 | |
| Payout ratio | 3 | |
| Financial stability | 4 | |
| Dividend continuity | 5 | |
| Cashflow Coverage | 3 | |
| Balance Sheet Quality | 3 |
Total Score: 31/40
✅ Rating
Motorola Solutions, Inc. presents a robust dividend profile with notable financial health and stability. Its longstanding dividend policies are marked by consistent growth, albeit with measured caution due to capital and cash flow adequacy. Recommended for investors seeking durable income and moderate equity growth potential.