November 24, 2025 a 02:47 am

MSI: Dividend Analysis - Motorola Solutions, Inc.
Motorola Solutions, Inc. presents an intriguing dividend profile with moderate yields and outstanding dividend history. The company maintains a robust 54-year dividend continuity, reflecting a significant commitment to shareholder returns. Though yields are modest, steady growth and a conservative payout ratio support a sustainable dividend policy.
Overview 📊
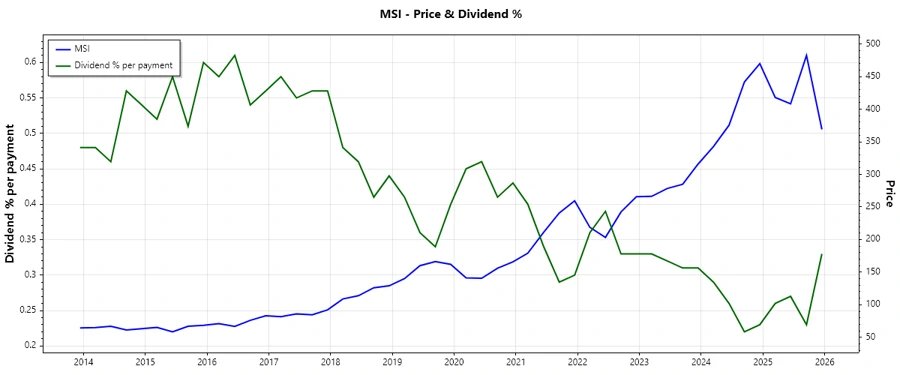
Motorola Solutions, Inc. operates within the technology sector, showcasing a commitment to consistent dividend payouts. This is demonstrated by its impressive 54-year history without any significant disruptions since 2011. The current dividend yield stands at 1.21%, complemented by a dividend per share of $3.92.
| Category | Value |
|---|---|
| Sector | Technology |
| Dividend Yield | 1.21 % |
| Current Dividend per Share | 3.92 USD |
| Dividend History | 54 years |
| Last Cut or Suspension | 2011 |
Dividend History 🗣️
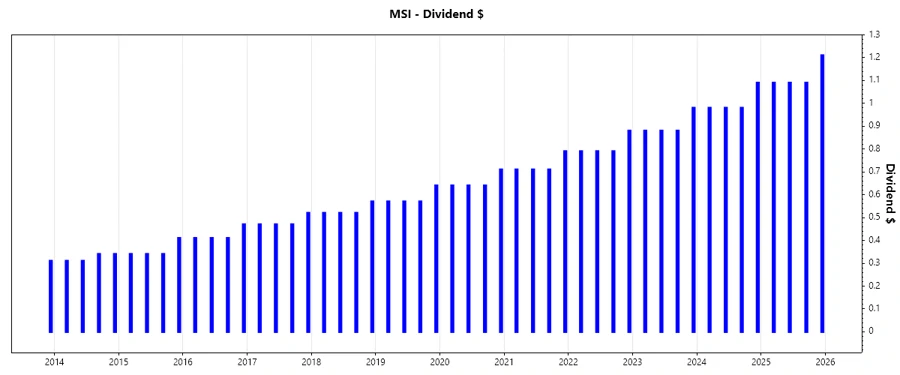
The dividend history of Motorola Solutions is a testament to its resilience and commitment. Notably, with a track record spanning over five decades, it is crucial in evaluating the company's financial health and shareholder-focused strategy.
| Year | Dividend per Share (USD) |
|---|---|
| 2025 | 4.48 |
| 2024 | 4.03 |
| 2023 | 3.62 |
| 2022 | 3.25 |
| 2021 | 2.92 |
Dividend Growth 📈
Understanding dividend growth rates is essential, as it impacts long-term investment returns. Motorolla Solutions displays consistent dividend growth, beneficial for appraising its return potential over time.
| Time | Growth |
|---|---|
| 3 years | 11.34 % |
| 5 years | 11.39 % |
The average dividend growth is 11.39 % over 5 years. This shows moderate but steady dividend growth.
Payout Ratio ✅
Payout ratios are instrumental in assessing a company’s dividend sustainability. Motorola Solutions keeps both EPS-based and free cash flow-based payout ratios well below risk thresholds.
| Key Figure | Ratio |
|---|---|
| EPS-based | 30.87 % |
| Free Cash Flow-based | 27.05 % |
A payout ratio of 30.87 % (EPS) and 27.05 % (FCF) indicates a prudently managed dividend strategy, ensuring manageable dividend obligations.
Cashflow & Capital Efficiency 🚀
The cash flow analysis highlights Motorola Solutions' capability to generate free cash from operations, crucial for covering dividends and supporting ongoing investments. Key efficiency metrics underscore operational strength.
| Metric | 2024 | 2023 | 2022 |
|---|---|---|---|
| Free Cash Flow Yield | 2.77 % | 3.43 % | 3.63 % |
| Earnings Yield | 2.04 % | 3.27 % | 3.16 % |
| CAPEX to Operating Cash Flow | 10.75 % | 12.38 % | 14.04 % |
| Stock-based Compensation to Revenue | 2.25 % | 2.12 % | 1.89 % |
| Free Cash Flow / Operating Cash Flow Ratio | 89.25 % | 87.62 % | 85.96 % |
Motorola Solutions demonstrates reliable cash flow generation, with consistent cash flow ratios supporting robust capital efficiency and sustainability.
Balance Sheet & Leverage Analysis ⚖️
A strong balance sheet and prudent leverage practices are vital for financial resilience. Motorola's debt ratios suggest meaningful leverage, yet within plausible limits for its operational scope.
| Metric | 2024 | 2023 | 2022 |
|---|---|---|---|
| Debt-to-Equity | 3.85 | 9.05 | 56.47 |
| Debt-to-Assets | 44.89 % | 49.11 % | 51.12 % |
| Debt-to-Capital | 79.37 % | 90.05 % | 98.26 % |
| Net Debt to EBITDA | 1.71 | 1.76 | 2.38 |
| Current Ratio | 0.00 | 0.00 | 1.15 |
| Quick Ratio | 1.13 | 0.85 | 0.92 |
| Financial Leverage | 8.57 | 18.42 | 110.47 |
Despite high debt ratios, Motorola Solutions mitigates financial risk with efficient leverage management backed by strong cash flow coverage.
Fundamental Strength & Profitability 💼
Key profitability metrics reflect Motorola's operational efficiency, alongside its commitment to maintaining compelling margins across its operation spectrum.
| Metric | 2024 | 2023 | 2022 |
|---|---|---|---|
| Return on Equity | 92.60 % | 236.05 % | 1175.00 % |
| Return on Assets | 10.81 % | 12.81 % | 10.64 % |
| Net Profit Margin | 14.58 % | 17.13 % | 14.96 % |
| EBIT Margin | 20.96 % | 24.00 % | 19.26 % |
| EBITDA Margin | 24.06 % | 27.57 % | 24.09 % |
| Gross Margin | 50.96 % | 49.81 % | 46.41 % |
| Research & Development to Revenue | 8.48 % | 8.60 % | 8.55 % |
Motorola Solutions maintains strong profitability metrics, with significant returns on equity and assets, ensuring it remains a robust entity in its sector.
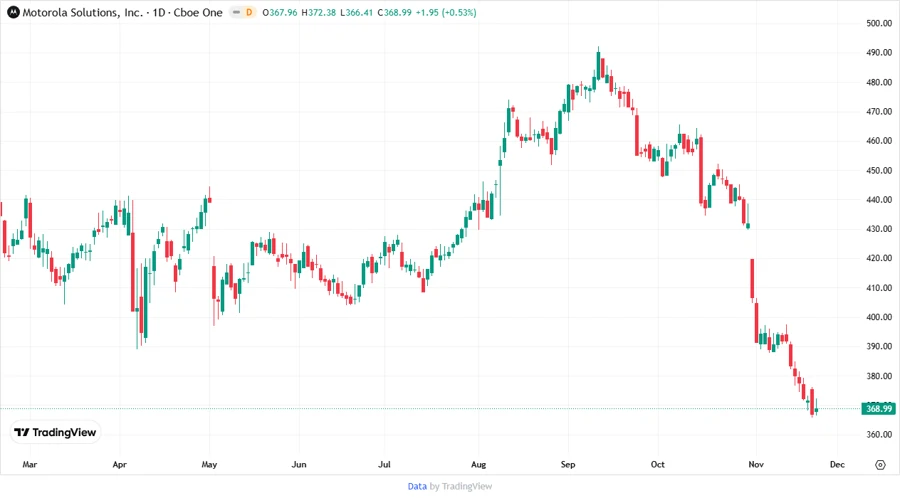
Price Development 📉
Dividend Scoring System 🏆
| Criteria | Score | |
|---|---|---|
| Dividend Yield | 3 | |
| Dividend Stability | 5 | |
| Dividend Growth | 4 | |
| Payout Ratio | 4 | |
| Financial Stability | 4 | |
| Dividend Continuity | 5 | |
| Cashflow Coverage | 4 | |
| Balance Sheet Quality | 3 |
Total Score: 32/40
Rating ⭐
Motorola Solutions, Inc. displays a well-rounded dividend profile, with solid stability and sustainability indicators. Its strong historical continuity and well-managed payout ratios make it an attractive option for income-focused investors. Offering moderate yields amplified by reliable growth and financial downstream efficiency, it holds a "Hold" recommendation for investors seeking balanced income and growth opportunities.
Smart Data Insight
Master the Perfect Entry & Exit for this Stock
Don't leave your profits to chance. Historically, this stock follows specific seasonal patterns that institutional traders use to maximize returns.
- ✅ Identify the "Golden Buying Window"
- ✅ Avoid high-risk correction cycles
- ✅ Backtested data from the last 20+ years