July 25, 2025 a 07:46 am


MSI: Dividend Analysis - Motorola Solutions, Inc.
Motorola Solutions, Inc. offers an attractive opportunity for dividend investors with a long history of uninterrupted dividend payments. The company's consistent growth in dividends, coupled with a manageable payout ratio, bolsters its status as a reliable dividend-paying stock. Below is an in-depth analysis of its dividend profile and financial health.
📊 Overview
Motorola Solutions operates in a resilient sector with a modest dividend yield of 1.04%. The current dividend per share is $3.92, with an impressive dividend history spanning 54 years, showcasing an unbroken commitment to shareholders.
| Metric | Detail |
|---|---|
| Sector | Technology |
| Dividend Yield | 1.04% |
| Current Dividend per Share | $3.92 |
| Dividend History | 54 years |
| Last Cut or Suspension | None |
📈 Dividend History
Motorola Solutions' extensive dividend history of 54 years is a testament to its operational stability and robust cash flow generation. The uninterrupted streak highlights management's commitment to rewarding shareholders.
| Year | Dividend per Share (USD) |
|---|---|
| 2025 | $2.18 |
| 2024 | $4.03 |
| 2023 | $3.62 |
| 2022 | $3.25 |
| 2021 | $2.92 |
📉 Dividend Growth
The company demonstrates moderate but stable growth, with a 3-year dividend growth of 11.34% and a 5-year growth rate of 11.39%. This consistent increase signals management's confidence in its financial outlook.
| Time | Growth |
|---|---|
| 3 years | 11.34% |
| 5 years | 11.39% |
The average dividend growth is 11.39% over 5 years. This shows moderate but steady dividend growth.
✅ Payout Ratio
Payout ratios give insight into how sustainable a company's dividend payments are. Motorola Solutions' EPS-based payout ratio is 31.98%, and the FCF-based payout ratio is 28.82%, both indicating a strong capacity to maintain its dividend policy.
| Key Figure | Ratio |
|---|---|
| EPS-based | 31.98% |
| Free Cash Flow-based | 28.82% |
Both EPS and FCF ratios suggest a responsible and sustainable approach to dividend payments, ensuring shareholder returns while allowing for business reinvestments.
🗣️ Cashflow & Capital Efficiency
Cash flow from operations and capital efficiency lie at the heart of dividend sustainability. Motorola Solutions' metrics reflect a disciplined financial strategy, supporting steady dividend distribution.
| Year | 2024 | 2023 | 2022 |
|---|---|---|---|
| Free Cash Flow Yield | 2.77% | 3.43% | 3.63% |
| Earnings Yield | 2.05% | 3.27% | 3.16% |
| CAPEX to Operating Cash Flow | 10.75% | 12.38% | 14.04% |
| Stock-Based Compensation to Revenue | 2.25% | 2.12% | 1.89% |
| Free Cash Flow / Operating Cash Flow Ratio | 89.25% | 87.62% | 85.96% |
The stability in free cash flow and capital efficiency supports Motorola Solutions' capacity to distribute dividends without hampering its growth initiatives.
🗣️ Balance Sheet & Leverage Analysis
Balance sheet strength is critical for sustaining long-term dividend payout capabilities. Motorola's prudent financial leverage metrics underline a focus on maintaining solvency and efficient capital structure.
| Year | 2024 | 2023 | 2022 |
|---|---|---|---|
| Debt-to-Equity | 3.85 | 9.05 | 56.47 |
| Debt-to-Assets | 44.89% | 49.12% | 51.12% |
| Debt-to-Capital | 79.37% | 90.05% | 98.26% |
| Net Debt to EBITDA | 1.68 | 1.76 | 2.32 |
| Current Ratio | 1.28 | 1.00 | 1.15 |
| Quick Ratio | 1.13 | 0.85 | 0.92 |
| Financial Leverage | 8.57 | 18.42 | 110.47 |
Despite existing leverage, metrics such as net debt to EBITDA and interest coverage reveal sufficient capacity to manage debt obligations effectively, ensuring liquidity and dividend continuity.
🗣️ Fundamental Strength & Profitability
Fundamental strengths gauge a firm's ability to generate profit while managing costs. Motorola Solutions' solid return rates and profit margins vouch for its profitability and competitive positioning.
| Year | 2024 | 2023 | 2022 |
|---|---|---|---|
| Return on Equity | 92.60% | 236.05% | 117.50% |
| Return on Assets | 10.81% | 12.81% | 10.64% |
| Margins: Net | 14.58% | 17.13% | 14.96% |
| Margins: EBIT | 20.96% | 24.00% | 19.26% |
| Margins: EBITDA | 24.54% | 27.57% | 24.77% |
| Margins: Gross | 50.96% | 49.81% | 46.41% |
| R&D to Revenue | 8.48% | 8.60% | 8.55% |
The strong return metrics demonstrate Motorola Solutions' ability to leverage its assets and equity effectively, leading to sustained profitability and commodity excellence.
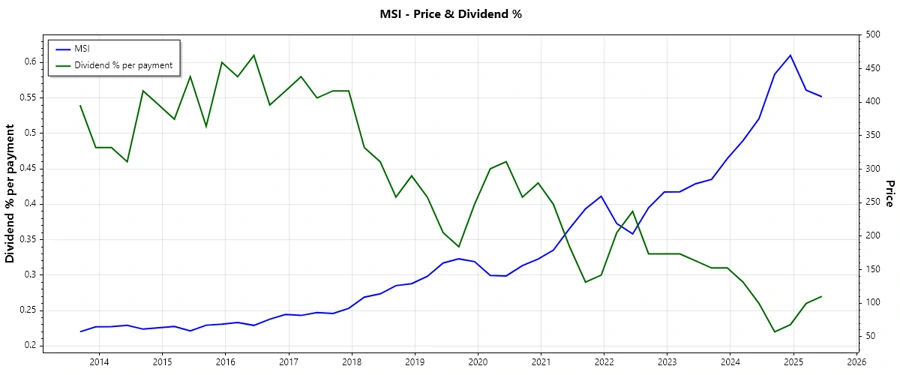
📉 Price Development
🗣️ Dividend Scoring System
| Criteria | Score | Score Bar |
|---|---|---|
| Dividend Yield | 3 | |
| Dividend Stability | 5 | |
| Dividend Growth | 4 | |
| Payout Ratio | 4 | |
| Financial Stability | 4 | |
| Dividend Continuity | 5 | |
| Cashflow Coverage | 4 | |
| Balance Sheet Quality | 3 |
Total Score: 32/40
🗣️ Rating
In conclusion, Motorola Solutions, Inc. presents a compelling case for dividend investors seeking stability and modest growth. The company's financial ratios suggest a robust ability to sustain its dividends, backed by strong cash flow and a strategic financial framework. While market yield might not be the highest, the dividend's reliability and the company's overall stability make it an attractive long-term investment.
Smart Data Insight
Master the Perfect Entry & Exit for this Stock
Don't leave your profits to chance. Historically, this stock follows specific seasonal patterns that institutional traders use to maximize returns.
- ✅ Identify the "Golden Buying Window"
- ✅ Avoid high-risk correction cycles
- ✅ Backtested data from the last 20+ years