June 06, 2025 a 02:46 am


MSI: Dividend Analysis - Motorola Solutions, Inc.
Motorola Solutions, Inc., a consistent player in the dividend-paying sector, provides a robust dividend history and stability that attracts investors seeking steady income. The company's dividend policy exemplifies resilience with a low payout ratio, signaling room for future dividend growth. However, its financial leverage indicates a high debt level that warrants careful monitoring.
📊 Overview
Motorola Solutions, Inc., operating in the Communications Equipment sector, presents key dividend metrics that highlight its strong commitment to shareholders.
| Metric | Value |
|---|---|
| Sector | Communications Equipment |
| Dividend Yield | 1.02% |
| Current Dividend per Share | 3.92 USD |
| Dividend History | 54 years |
| Last Cut or Suspension | None |
📈 Dividend History
The company boasts an impressive 54-year dividend history with no cuts, an indicator of stability and shareholder value prioritization. This historical consistency provides confidence in the company’s ability to maintain its dividend commitments even in challenging markets. Such a track record is invaluable for long-term income-focused investors.
| Year | Dividend per Share (USD) |
|---|---|
| 2025 | 2.18 |
| 2024 | 4.03 |
| 2023 | 3.62 |
| 2022 | 3.25 |
| 2021 | 2.92 |
📉 Dividend Growth
The dividend growth rate over the last 3 and 5 years reflects Motorola Solutions, Inc.'s dedication to enhancing shareholder returns. Steady growth rates indicate prudent financial management and commitment to rewarding shareholders.
| Time | Growth |
|---|---|
| 3 years | 11.34% |
| 5 years | 11.39% |
The average dividend growth is 11.39% over 5 years. This shows moderate but steady dividend growth.
✅ Payout Ratio
The payout ratio is a crucial indicator of dividend sustainability. It determines the proportion of earnings paid to shareholders, reflecting balance between rewarding investors and reinvesting for growth.
| Key Figure | Ratio |
|---|---|
| EPS-based | 31.98% |
| Free cash flow-based | 28.82% |
With a 31.98% EPS-based payout ratio and a 28.82% FCF-based payout ratio, Motorola shows a conservative payout strategy, allowing significant room for future dividend increases or financial reinvestment.
💡 Cashflow & Capital Efficiency
Evaluating cash flow and capital efficiency metrics gives insights into Motorola's operational strength and its ability to fund dividends sustainably.
| Metric | 2024 | 2023 | 2022 |
|---|---|---|---|
| Free Cash Flow Yield | 3.27% | 3.43% | 3.63% |
| Earnings Yield | 2.05% | 3.27% | 3.16% |
| CAPEX to Operating Cash Flow | 9.85% | 12.38% | 14.04% |
| Stock-based Compensation to Revenue | 2.31% | 2.12% | 1.89% |
| Free Cash Flow / Operating Cash Flow Ratio | 89.25% | 87.62% | 85.96% |
The ratios suggest Motorola's ability to generate substantial cash flow to support its operations and dividends, despite heavy capital expenditure requirements.
🗣️ Balance Sheet & Leverage Analysis
This analysis inspects Motorola Solutions' balance sheet to evaluate financial stability and leverage levels, crucial for assessing dividend security.
| Metric | 2024 | 2023 | 2022 |
|---|---|---|---|
| Debt-to-Equity | 3.85 | 9.05 | 56.47 |
| Debt-to-Assets | 44.89% | 49.12% | 51.12% |
| Debt-to-Capital | 79.37% | 90.05% | 98.26% |
| Net Debt to EBITDA | 1.68 | 1.76 | 2.32 |
| Current Ratio | 1.28 | 0.99 | 1.15 |
| Quick Ratio | 1.13 | 0.85 | 0.92 |
| Financial Leverage | 8.57 | 18.42 | 110.47 |
The considerable financial leverage and debt metrics require hurdle-free cash flows for sustainable dividend payments and reduced risk.
🔍 Fundamental Strength & Profitability
Fundamentals and profitability delve into the operational efficiency and effective capital deployment by Motorola Solutions.
| Metric | 2024 | 2023 | 2022 |
|---|---|---|---|
| Return on Equity | 92.60% | 236.05% | 1,175.00% |
| Return on Assets | 10.81% | 12.81% | 10.64% |
| Margins: Net | 14.58% | 17.13% | 14.96% |
| EBIT | 20.96% | 24.00% | 19.26% |
| EBITDA | 24.54% | 27.57% | 24.77% |
| Gross | 50.96% | 49.81% | 46.41% |
| R&D to Revenue | 8.42% | 8.60% | 8.55% |
The company's profitability metrics, particularly ROE, highlight strength but significant variability outlines operational challenges, necessitating attention for future strategic positioning.
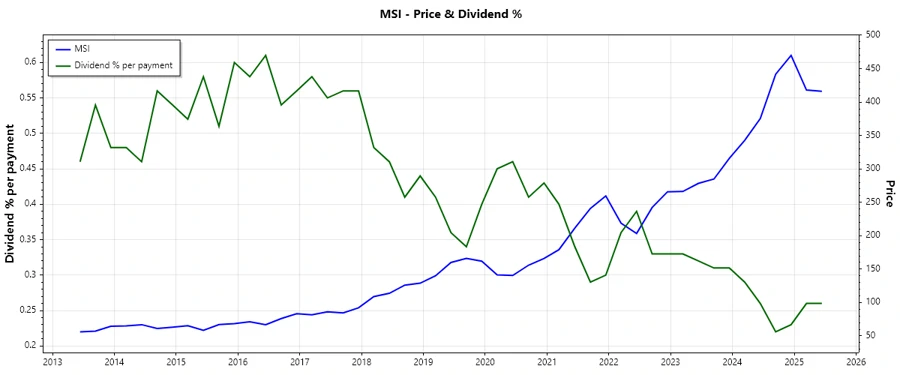
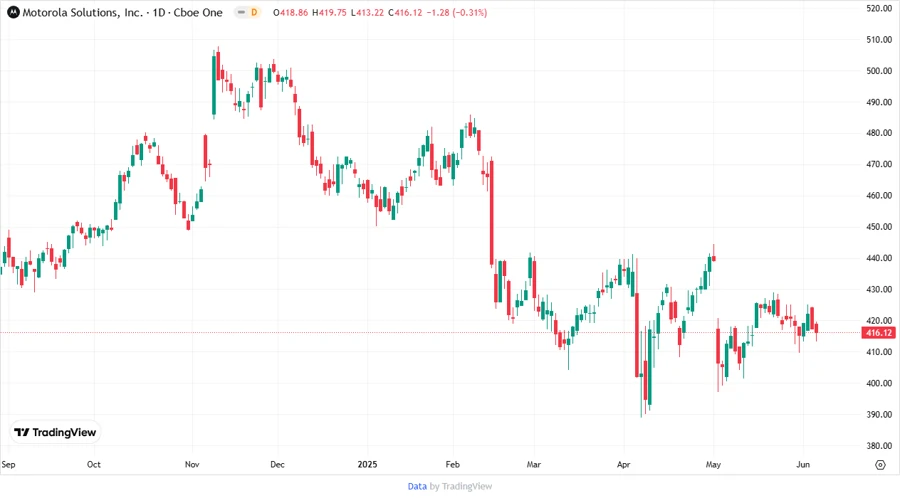
📈 Price Development
📊 Dividend Scoring System
| Criteria | Score | Visual |
|---|---|---|
| Dividend Yield | 2 | |
| Dividend Stability | 5 | |
| Dividend Growth | 4 | |
| Payout Ratio | 5 | |
| Financial stability | 3 | |
| Dividend Continuity | 5 | |
| Cashflow Coverage | 4 | |
| Balance Sheet Quality | 3 |
Overall Score: 31/40
📉 Rating
Conclusively, Motorola Solutions, Inc. stands as a fundamentally strong company with commendable dividend reliability and potential growth prospects. While leverage remains elevated, vigilant cash flow management and robust profitability metrics suggest a solid investment opportunity for dividend-centric investors, albeit with moderate risk considerations.
Smart Data Insight
Master the Perfect Entry & Exit for this Stock
Don't leave your profits to chance. Historically, this stock follows specific seasonal patterns that institutional traders use to maximize returns.
- ✅ Identify the "Golden Buying Window"
- ✅ Avoid high-risk correction cycles
- ✅ Backtested data from the last 20+ years