April 15, 2026 a 03:15 am
MSFT: Trend and Support & Resistance Analysis - Microsoft Corporation
Microsoft Corporation (MSFT) has shown a significant downtrend over the past months, reflecting declining investor confidence possibly due to market conditions or internal challenges. However, recent price movements indicate potential stabilization around key support zones, suggesting a possibility for reversal. Investors should monitor these levels closely for buying opportunities or further declines.
Trend Analysis
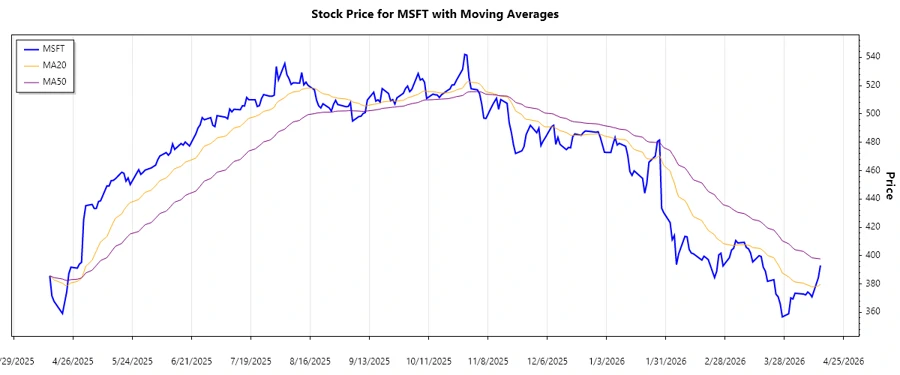
The trend analysis for Microsoft Corporation based on the provided data suggests a downtrend. The calculation of the EMA20 and EMA50 demonstrates the following trend:
- With EMA20 calculated at 395.22
- EMA50 calculated at 422.47
- Signal: ▼ Abwärtstrend
| Date | Closing Price | Trend |
|---|---|---|
| 2026-04-14 | $393.11 | ▼ |
| 2026-04-13 | $384.37 | ▼ |
| 2026-04-10 | $370.87 | ▼ |
| 2026-04-09 | $373.07 | ▼ |
| 2026-04-08 | $374.33 | ▼ |
| 2026-04-07 | $372.29 | ▼ |
| 2026-04-06 | $372.88 | ▼ |
The downtrend is supported by the decreasing EMA20 vis-a-vis EMA50. Any reversal in trend might only commence with consistent price closings above the EMA50.
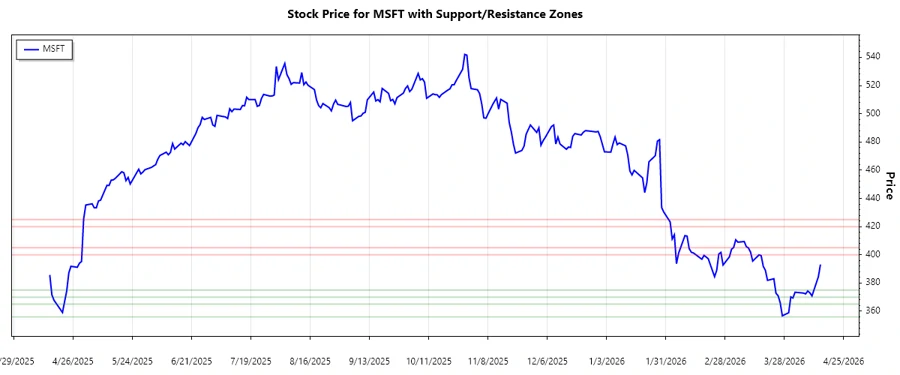
Support and Resistance
Based on analysis, the following support and resistance zones have been identified:
| Zone Type | From | To |
|---|---|---|
| Support | $370 | $375 |
| Support | $356 | $365 |
| Resistance | $400 | $405 |
| Resistance | $420 | $425 |
The current trading price lies within a support zone of $370-$375, indicating that investors might find it a buying opportunity if the price holds. Breaking below this region may signal further downturns.
Conclusion
The current analysis of Microsoft Corporation (MSFT) underscores a dominant bearish trend as reinforced by the price patterns below key EMAs and support levels. The risk of further declines remains present, primarily if the support levels are breached. Nonetheless, any sustained upward movement or a closing value above highlighted resistance levels can reignite a potential bullish trajectory. For investors, continuous monitoring is advised, leveraging current levels to devise strategic entry or exit based on upcoming market cues and corporate announcements.