TRGP: Analysts Ratings - Targa Resources Corp

TRGP: Comprehensive breakdown of current and historical analyst ratings, offering insights into how expert sentiment has evolved over time.
April 18, 2026 a 05:00 pm
MA: Fibunacci Level Technical Analysis - Mastercard Incorporated

MA: Fibonacci retracement levels to identify key potential support and resistance zones, based on recent price trends.
April 18, 2026 a 04:44 pm
WYNN: Analysts Ratings - Wynn Resorts Limited

WYNN: Comprehensive breakdown of current and historical analyst ratings, offering insights into how expert sentiment has evolved over time.
April 18, 2026 a 04:38 pm
HIG: Fundamental Ratio Analysis - The Hartford Financial Services Group Inc

HIG: Evaluation of key financial ratios, analyst ratings, and price targets. A data-driven perspective on the valuation and market expectations.
April 18, 2026 a 03:43 pm
Consumer Staples Comparison. 18 Apr

Comparison of Consumer Staples. Where is strength and weakness? What has developed well and badly?
April 18, 2026 a 03:32 pm
CVS: Dividend Analysis - CVS Health Corporation

CVS: In-depth analysis of a company's dividend stability and key fundamental ratios to assess its financial strength and long-term investment potential.
April 18, 2026 a 03:31 pm
EOG: Fibunacci Level Technical Analysis - EOG Resources Inc

EOG: Fibonacci retracement levels to identify key potential support and resistance zones, based on recent price trends.
April 18, 2026 a 03:15 pm

CAH: Analysts Ratings - Cardinal Health Inc
April 18, 2026 a 09:00 pm

ON: Analysts Ratings - ON Semiconductor Corporation
April 18, 2026 a 08:38 pm

WM: Fundamental Ratio Analysis - Waste Management Inc
April 18, 2026 a 07:43 pm

CRWD: Fundamental Ratio Analysis - CrowdStrike Holdings Inc
April 18, 2026 a 06:00 pm
MNST: Trend with Support and Resistance Levels - Monster Beverage Corporation
MNST: Current price trend is evaluated alongside key support and resistance level. View of potential turning points and price momentum.
April 18, 2026 a 02:03 pm
ARES: Trend with Support and Resistance Levels - Ares Management Corporation
ARES: Current price trend is evaluated alongside key support and resistance level. View of potential turning points and price momentum.
April 18, 2026 a 01:15 pm
FANG: Analysts Ratings - Diamondback Energy Inc
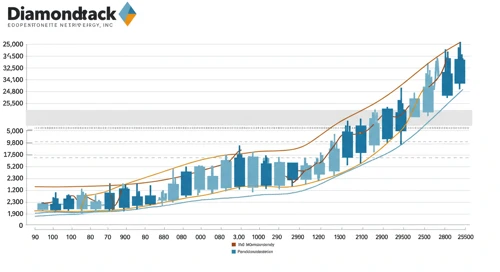
FANG: Comprehensive breakdown of current and historical analyst ratings, offering insights into how expert sentiment has evolved over time.
April 18, 2026 a 01:00 pm
DLR: Fundamental Ratio Analysis - Digital Realty Trust Inc

DLR: Evaluation of key financial ratios, analyst ratings, and price targets. A data-driven perspective on the valuation and market expectations.
April 18, 2026 a 01:00 pm
MAA: Dividend Analysis - Mid America Apartment Communities Inc

MAA: In-depth analysis of a company's dividend stability and key fundamental ratios to assess its financial strength and long-term investment potential.
April 18, 2026 a 12:46 pm
RJF: Analysts Ratings - Raymond James Financial Inc

RJF: Comprehensive breakdown of current and historical analyst ratings, offering insights into how expert sentiment has evolved over time.
April 18, 2026 a 12:38 pm
Crypto Comparison. 18 Apr

Comparison of Crypto. Where is strength and weakness? What has developed well and badly?
April 18, 2026 a 12:31 pm
Stock Market - Heatmap
Use mouse wheel to zoom in and out. Click a ticker to display detailed information in a new window. Hover mouse cursor over a ticker to see more data.
Stock's
KKR: Trend with Support and Resistance Levels - KKR and Co Inc
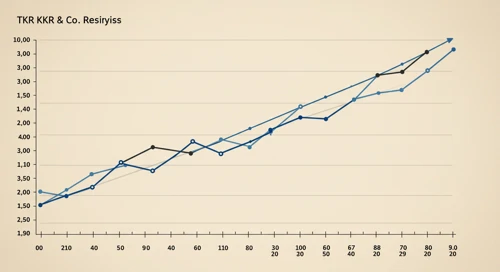
KKR: Current price trend is evaluated alongside key support and resistance level. View of potential turning points and price momentum.
April 18, 2026 a 09:03 am
ULTA: Analysts Ratings - Ulta Beauty Inc

ULTA: Comprehensive breakdown of current and historical analyst ratings, offering insights into how expert sentiment has evolved over time.
April 18, 2026 a 09:00 am
ITW: Analysts Ratings - Illinois Tool Works Inc

ITW: Comprehensive breakdown of current and historical analyst ratings, offering insights into how expert sentiment has evolved over time.
April 18, 2026 a 08:38 am
V: Trend with Support and Resistance Levels - Visa Inc

V: Current price trend is evaluated alongside key support and resistance level. View of potential turning points and price momentum.
April 18, 2026 a 08:15 am
CFG: Fundamental Ratio Analysis - Citizens Financial Group Inc

CFG: Evaluation of key financial ratios, analyst ratings, and price targets. A data-driven perspective on the valuation and market expectations.
April 18, 2026 a 08:00 am
ALB: Dividend Analysis - Albemarle Corporation

ALB: In-depth analysis of a company's dividend stability and key fundamental ratios to assess its financial strength and long-term investment potential.
April 18, 2026 a 07:46 am
MLM: Fundamental Ratio Analysis - Martin Marietta Materials Inc

MLM: Evaluation of key financial ratios, analyst ratings, and price targets. A data-driven perspective on the valuation and market expectations.
April 18, 2026 a 07:43 am

ORCL: Fibunacci Level Technical Analysis - Oracle Corporation
April 18, 2026 a 11:44 am
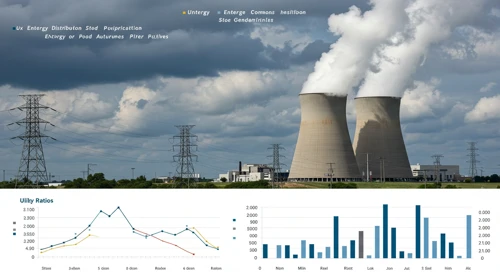
ETR: Fundamental Ratio Analysis - Entergy Corporation
April 18, 2026 a 11:43 am
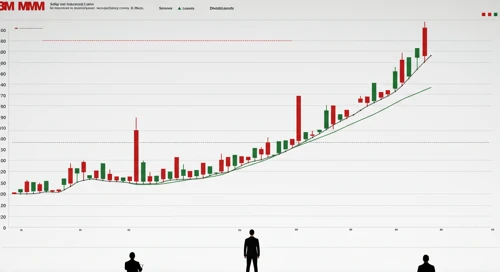
MMM: Dividend Analysis - 3M Company
April 18, 2026 a 11:31 am

EBAY: Fibunacci Level Technical Analysis - eBay Inc
April 18, 2026 a 10:15 am
XYL: Dividend Analysis - Xylem Inc

XYL: In-depth analysis of a company's dividend stability and key fundamental ratios to assess its financial strength and long-term investment potential.
April 18, 2026 a 07:30 am
WBD: Fibunacci Level Technical Analysis - Warner Bros Discovery Inc
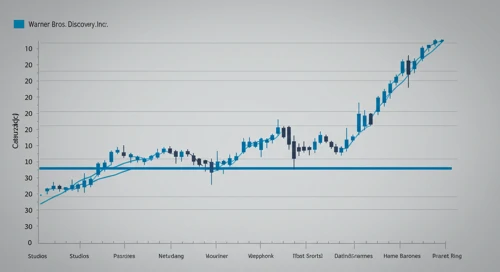
WBD: Fibonacci retracement levels to identify key potential support and resistance zones, based on recent price trends.
April 18, 2026 a 06:44 am
CHD: Fibunacci Level Technical Analysis - Church and Dwight Co Inc
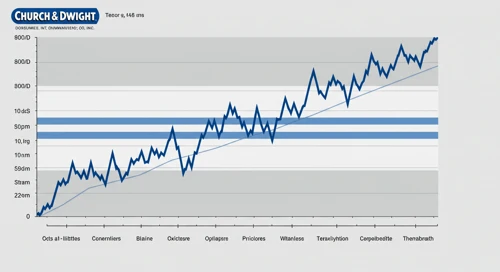
CHD: Fibonacci retracement levels to identify key potential support and resistance zones, based on recent price trends.
April 18, 2026 a 05:15 am
ED: Trend with Support and Resistance Levels - Consolidated Edison Inc
ED: Current price trend is evaluated alongside key support and resistance level. View of potential turning points and price momentum.
April 18, 2026 a 04:03 am
RF: Dividend Analysis - Regions Financial Corporation

RF: In-depth analysis of a company's dividend stability and key fundamental ratios to assess its financial strength and long-term investment potential.
April 18, 2026 a 03:31 am
BLK: Trend with Support and Resistance Levels - BlackRock Inc
BLK: Current price trend is evaluated alongside key support and resistance level. View of potential turning points and price momentum.
April 18, 2026 a 03:15 am
CMCSA: Dividend Analysis - Comcast Corporation
CMCSA: In-depth analysis of a company's dividend stability and key fundamental ratios to assess its financial strength and long-term investment potential.
April 18, 2026 a 02:46 am
Economic Calendar
Currencies
NZDCAD: Fibunacci Level Technical Analysis
NZDCAD: Fibonacci retracement levels to identify key potential support and resistance zones, based on recent price trends.
April 17, 2026 a 05:08 am
EURGBP: Trend with Support and Resistance Levels
EURGBP: Current price trend is evaluated alongside key support and resistance level. View of potential turning points and price momentum.
April 17, 2026 a 04:28 am
Todays Important Key Figures 16 Apr
Today’s important economic data releases – a snapshot of key indicators influencing markets and shaping financial expectations.
April 16, 2026 a 07:00 pm
CHFJPY: Fibunacci Level Technical Analysis
CHFJPY: Fibonacci retracement levels to identify key potential support and resistance zones, based on recent price trends.
April 16, 2026 a 05:08 am
Important Key Figures of the last Days
Overview of key economic indicators released over the past days, highlighting their potential impact on markets and investor sentiment.
April 16, 2026 a 02:31 am
Todays Important Key Figures 15 Apr
Today’s important economic data releases – a snapshot of key indicators influencing markets and shaping financial expectations.
April 15, 2026 a 07:00 pm
EURNZD: Fibunacci Level Technical Analysis

EURNZD: Fibonacci retracement levels to identify key potential support and resistance zones, based on recent price trends.
April 15, 2026 a 05:08 am
EURAUD: Fibunacci Level Technical Analysis
April 18, 2026 a 05:08 am

CADCHF: Trend with Support and Resistance Levels
April 18, 2026 a 04:28 am

Todays Important Key Figures 18 Apr
April 17, 2026 a 11:00 pm
Todays Important Key Figures 17 Apr
April 17, 2026 a 07:00 pm
AUDNZD: Trend with Support and Resistance Levels

AUDNZD: Current price trend is evaluated alongside key support and resistance level. View of potential turning points and price momentum.
April 15, 2026 a 04:28 am
Todays Important Key Figures 14 Apr
Today’s important economic data releases – a snapshot of key indicators influencing markets and shaping financial expectations.
April 14, 2026 a 07:00 pm
GBPSEK: Fibunacci Level Technical Analysis
GBPSEK: Fibonacci retracement levels to identify key potential support and resistance zones, based on recent price trends.
April 14, 2026 a 05:08 am
GBPNZD: Trend with Support and Resistance Levels
GBPNZD: Current price trend is evaluated alongside key support and resistance level. View of potential turning points and price momentum.
April 14, 2026 a 04:28 am
Important Key Figures of the last Days
Overview of key economic indicators released over the past days, highlighting their potential impact on markets and investor sentiment.
April 14, 2026 a 02:31 am
Todays Important Key Figures 13 Apr

Today’s important economic data releases – a snapshot of key indicators influencing markets and shaping financial expectations.
April 13, 2026 a 07:00 pm
AUDCAD: Fibunacci Level Technical Analysis
AUDCAD: Fibonacci retracement levels to identify key potential support and resistance zones, based on recent price trends.
April 13, 2026 a 05:08 am
Currencies