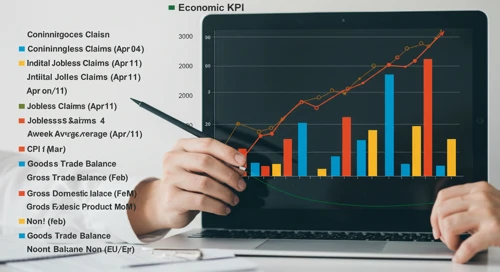
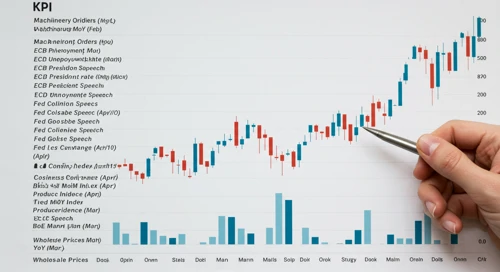
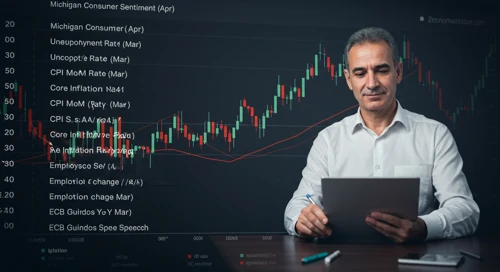
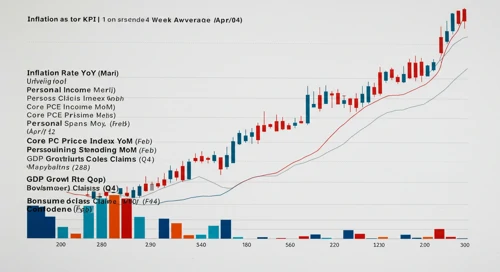
Important Key Figures of the last Days
Overview of key economic indicators released over the past days, highlighting their potential impact on markets and investor sentiment.
April 16, 2026 a 02:31 am
Todays Important Key Figures 16 Apr
Today’s important economic data releases – a snapshot of key indicators influencing markets and shaping financial expectations.
April 15, 2026 a 11:00 pm
TKO: Analysts Ratings - TKO Group Holdings Inc

TKO: Comprehensive breakdown of current and historical analyst ratings, offering insights into how expert sentiment has evolved over time.
April 15, 2026 a 09:00 pm
SCHW: Analysts Ratings - The Charles Schwab Corporation

SCHW: Comprehensive breakdown of current and historical analyst ratings, offering insights into how expert sentiment has evolved over time.
April 15, 2026 a 08:38 pm
TTD: Fundamental Ratio Analysis - The Trade Desk Inc
TTD: Evaluation of key financial ratios, analyst ratings, and price targets. A data-driven perspective on the valuation and market expectations.
April 15, 2026 a 07:43 pm
Todays Important Key Figures 15 Apr
Today’s important economic data releases – a snapshot of key indicators influencing markets and shaping financial expectations.
April 15, 2026 a 07:00 pm
NOW: Fundamental Ratio Analysis - ServiceNow Inc

NOW: Evaluation of key financial ratios, analyst ratings, and price targets. A data-driven perspective on the valuation and market expectations.
April 15, 2026 a 06:00 pm
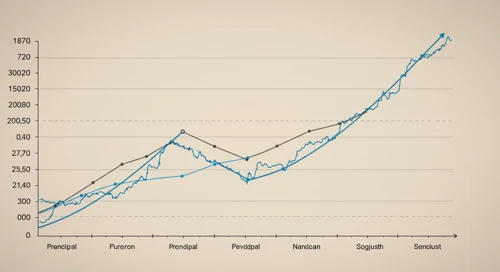
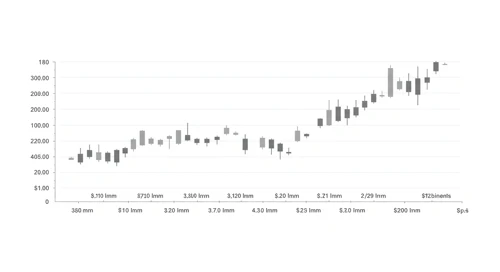
PFG: Trend with Support and Resistance Levels - Principal Financial Group Inc
April 16, 2026 a 04:03 am

MDT: Dividend Analysis - Medtronic plc
April 16, 2026 a 03:31 am
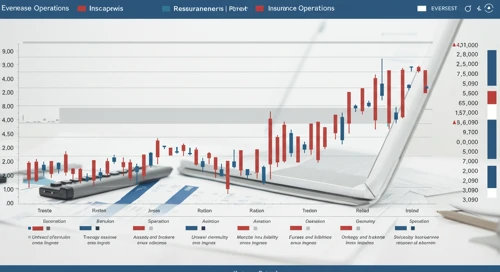
ES: Trend with Support and Resistance Levels - Eversource Energy
April 16, 2026 a 03:15 am

GIS: Dividend Analysis - General Mills Inc
April 16, 2026 a 02:46 am
CMG: Analysts Ratings - Chipotle Mexican Grill Inc
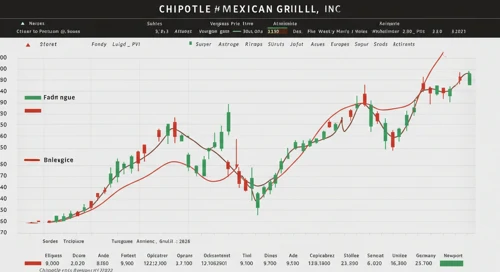
CMG: Comprehensive breakdown of current and historical analyst ratings, offering insights into how expert sentiment has evolved over time.
April 15, 2026 a 05:00 pm
GNRC: Fibunacci Level Technical Analysis - Generac Holdings Inc
GNRC: Fibonacci retracement levels to identify key potential support and resistance zones, based on recent price trends.
April 15, 2026 a 04:44 pm
EG: Analysts Ratings - Everest Re Group Ltd
EG: Comprehensive breakdown of current and historical analyst ratings, offering insights into how expert sentiment has evolved over time.
April 15, 2026 a 04:38 pm
WEC: Fundamental Ratio Analysis - WEC Energy Group Inc

WEC: Evaluation of key financial ratios, analyst ratings, and price targets. A data-driven perspective on the valuation and market expectations.
April 15, 2026 a 03:43 pm
Consumer Cyclical Comparison. 15 Apr

Comparison of Consumer Cyclical. Where is strength and weakness? What has developed well and badly?
April 15, 2026 a 03:31 pm
CDW: Dividend Analysis - CDW Corporation

CDW: In-depth analysis of a company's dividend stability and key fundamental ratios to assess its financial strength and long-term investment potential.
April 15, 2026 a 03:31 pm
VTRS: Fibunacci Level Technical Analysis - Viatris Inc
VTRS: Fibonacci retracement levels to identify key potential support and resistance zones, based on recent price trends.
April 15, 2026 a 03:15 pm
Stock Market - Heatmap
Use mouse wheel to zoom in and out. Click a ticker to display detailed information in a new window. Hover mouse cursor over a ticker to see more data.
Stock's
EQIX: Analysts Ratings - Equinix Inc

EQIX: Comprehensive breakdown of current and historical analyst ratings, offering insights into how expert sentiment has evolved over time.
April 15, 2026 a 12:38 pm
AVGO: Fibunacci Level Technical Analysis - Broadcom Inc

AVGO: Fibonacci retracement levels to identify key potential support and resistance zones, based on recent price trends.
April 15, 2026 a 11:44 am
HUBB: Fundamental Ratio Analysis - Hubbell Incorporated
HUBB: Evaluation of key financial ratios, analyst ratings, and price targets. A data-driven perspective on the valuation and market expectations.
April 15, 2026 a 11:43 am
DUK: Dividend Analysis - Duke Energy Corporation

DUK: In-depth analysis of a company's dividend stability and key fundamental ratios to assess its financial strength and long-term investment potential.
April 15, 2026 a 11:31 am
ALLE: Fibunacci Level Technical Analysis - Allegion plc
ALLE: Fibonacci retracement levels to identify key potential support and resistance zones, based on recent price trends.
April 15, 2026 a 10:15 am
AVY: Trend with Support and Resistance Levels - Avery Dennison Corporation

AVY: Current price trend is evaluated alongside key support and resistance level. View of potential turning points and price momentum.
April 15, 2026 a 09:03 am
IFF: Analysts Ratings - International Flavors and Fragrances Inc

IFF: Comprehensive breakdown of current and historical analyst ratings, offering insights into how expert sentiment has evolved over time.
April 15, 2026 a 09:00 am

GOOGL: Trend with Support and Resistance Levels - Alphabet Inc
April 15, 2026 a 01:15 pm
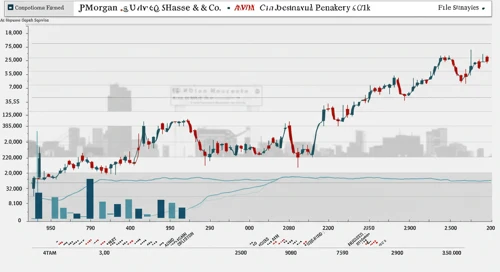
JPM: Analysts Ratings - JPMorgan Chase and Co
April 15, 2026 a 01:00 pm

BRO: Fundamental Ratio Analysis - Brown and Brown Inc
April 15, 2026 a 01:00 pm
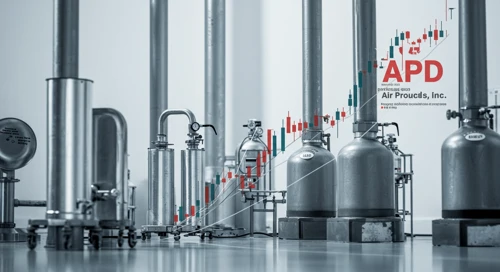
APD: Dividend Analysis - Air Products and Chemicals Inc
April 15, 2026 a 12:46 pm
AMCR: Analysts Ratings - Amcor plc

AMCR: Comprehensive breakdown of current and historical analyst ratings, offering insights into how expert sentiment has evolved over time.
April 15, 2026 a 08:38 am
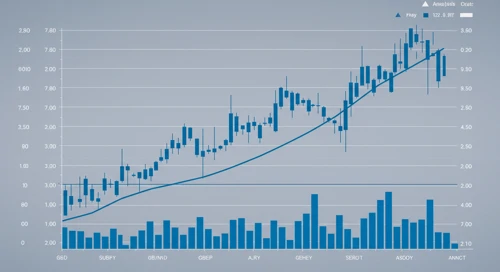
WAT: Trend with Support and Resistance Levels - Waters Corporation

WAT: Current price trend is evaluated alongside key support and resistance level. View of potential turning points and price momentum.
April 15, 2026 a 08:15 am
EXPE: Fundamental Ratio Analysis - Expedia Group Inc

EXPE: Evaluation of key financial ratios, analyst ratings, and price targets. A data-driven perspective on the valuation and market expectations.
April 15, 2026 a 08:00 am
BAC: Fundamental Ratio Analysis - Bank of America Corporation

BAC: Evaluation of key financial ratios, analyst ratings, and price targets. A data-driven perspective on the valuation and market expectations.
April 15, 2026 a 07:43 am
CPT: Dividend Analysis - Camden Property Trust

CPT: In-depth analysis of a company's dividend stability and key fundamental ratios to assess its financial strength and long-term investment potential.
April 15, 2026 a 07:31 am
ROST: Fibunacci Level Technical Analysis - Ross Stores Inc
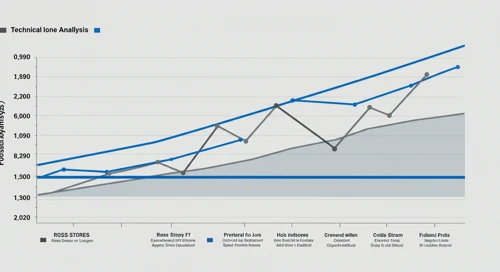
ROST: Fibonacci retracement levels to identify key potential support and resistance zones, based on recent price trends.
April 15, 2026 a 06:44 am
RJF: Fibunacci Level Technical Analysis - Raymond James Financial Inc

RJF: Fibonacci retracement levels to identify key potential support and resistance zones, based on recent price trends.
April 15, 2026 a 05:15 am
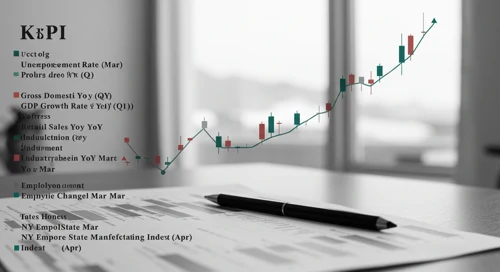
Economic Calendar
Currencies
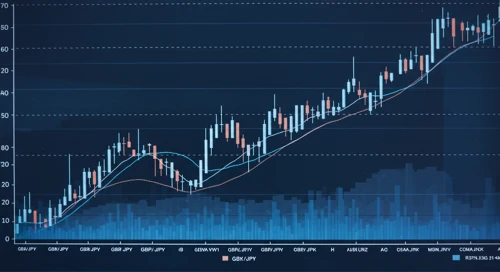
GBPNZD: Trend with Support and Resistance Levels
GBPNZD: Current price trend is evaluated alongside key support and resistance level. View of potential turning points and price momentum.
April 14, 2026 a 04:28 am
Important Key Figures of the last Days
Overview of key economic indicators released over the past days, highlighting their potential impact on markets and investor sentiment.
April 14, 2026 a 02:31 am
Todays Important Key Figures 13 Apr

Today’s important economic data releases – a snapshot of key indicators influencing markets and shaping financial expectations.
April 13, 2026 a 07:00 pm
AUDCAD: Fibunacci Level Technical Analysis
AUDCAD: Fibonacci retracement levels to identify key potential support and resistance zones, based on recent price trends.
April 13, 2026 a 05:08 am
GBPJPY: Trend with Support and Resistance Levels
GBPJPY: Current price trend is evaluated alongside key support and resistance level. View of potential turning points and price momentum.
April 13, 2026 a 04:28 am
GBPAUD: Fibunacci Level Technical Analysis
GBPAUD: Fibonacci retracement levels to identify key potential support and resistance zones, based on recent price trends.
April 12, 2026 a 05:08 am
USDCHF: Trend with Support and Resistance Levels
USDCHF: Current price trend is evaluated alongside key support and resistance level. View of potential turning points and price momentum.
April 12, 2026 a 04:28 am

EURNZD: Fibunacci Level Technical Analysis
April 15, 2026 a 05:08 am

AUDNZD: Trend with Support and Resistance Levels
April 15, 2026 a 04:28 am
Todays Important Key Figures 14 Apr
April 14, 2026 a 07:00 pm

GBPSEK: Fibunacci Level Technical Analysis
April 14, 2026 a 05:08 am
AUDUSD: Fibunacci Level Technical Analysis
AUDUSD: Fibonacci retracement levels to identify key potential support and resistance zones, based on recent price trends.
April 11, 2026 a 05:08 am
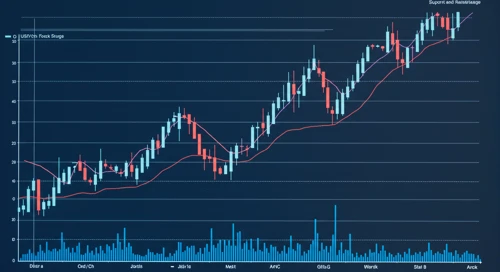
EURUSD: Trend with Support and Resistance Levels
EURUSD: Current price trend is evaluated alongside key support and resistance level. View of potential turning points and price momentum.
April 11, 2026 a 04:28 am
Todays Important Key Figures 11 Apr
Today’s important economic data releases – a snapshot of key indicators influencing markets and shaping financial expectations.
April 10, 2026 a 11:00 pm
Todays Important Key Figures 10 Apr
Today’s important economic data releases – a snapshot of key indicators influencing markets and shaping financial expectations.
April 10, 2026 a 07:00 pm
GBPCHF: Fibunacci Level Technical Analysis

GBPCHF: Fibonacci retracement levels to identify key potential support and resistance zones, based on recent price trends.
April 10, 2026 a 05:08 am
CADCHF: Trend with Support and Resistance Levels

CADCHF: Current price trend is evaluated alongside key support and resistance level. View of potential turning points and price momentum.
April 10, 2026 a 04:28 am
Todays Important Key Figures 09 Apr
Today’s important economic data releases – a snapshot of key indicators influencing markets and shaping financial expectations.
April 09, 2026 a 07:00 pm
Currencies