May 10, 2026 a 03:15 pm
MSFT: Fibonacci Analysis - Microsoft Corporation
Microsoft Corporation, one of the world's leading technology companies, operates across multiple segments, providing innovative products and services globally. The recent price action suggests a strong downtrend in the stock, marked by significant volatility. Investors should pay attention to key technical levels and Fibonacci retracements to evaluate potential entry and exit points. Understanding these technical signals is crucial for making informed investment decisions in such fluctuating market conditions.
Fibonacci Analysis
| Detail | Value |
|---|---|
| Start Date | 2025-12-01 |
| End Date | 2026-04-10 |
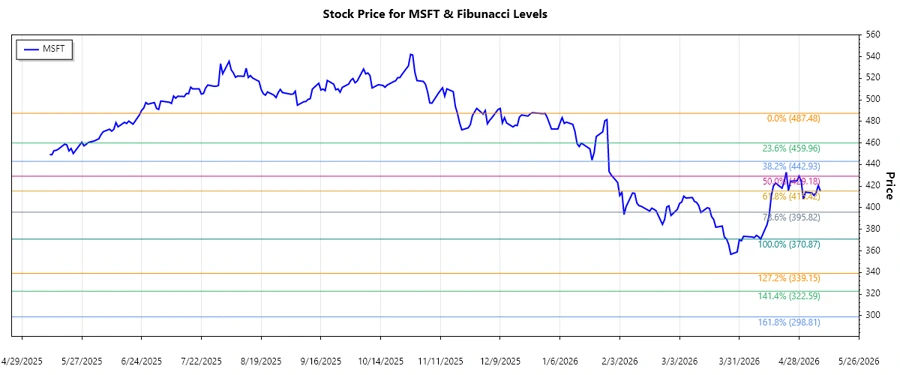
| High (Date & Price) | 2025-12-30 & $487.48 |
| Low (Date & Price) | 2026-04-10 & $370.87 |
| Fibonacci Level | Price Level |
|---|---|
| 0.236 | $393.86 |
| 0.382 | $421.62 |
| 0.5 | $429.18 |
| 0.618 | $436.74 |
| 0.786 | $465.08 |
The current price is within the 0.236 Fibonacci retracement zone. This indicates a potential support level, which might attract buyers. However, sustained movement below this level could lead to further declines.
Conclusion
The MSFT stock has recently been in a clear downtrend, with noticeable price declines from its highs in late December 2025. The stock is currently approaching a key support level at the 0.236 Fibonacci retracement, indicating a potential stabilization point. However, there is also risk potential if the price breaks below this level. Investors should closely watch for any changes in momentum or confirmations of support and resistance levels for strategic positioning. Understanding these technical nuances can be essential for navigating the volatile tech sector.
Smart Data Insight
Master the Perfect Entry & Exit for this Stock
Don't leave your profits to chance. Historically, this stock follows specific seasonal patterns that institutional traders use to maximize returns.
- ✅ Identify the "Golden Buying Window"
- ✅ Avoid high-risk correction cycles
- ✅ Backtested data from the last 20+ years