September 10, 2025 a 04:44 pm
MSFT: Fibonacci Analysis - Microsoft Corporation
In recent months, Microsoft Corporation (MSFT) has shown considerable price volatility, reflecting broader economic conditions and sector-specific challenges. As of the latest data, the stock appears to be trending downward, which may signal caution for short-term investors but potential opportunity for those focused on long-term gains. Analysts will need to consider Microsoft's strong position in the cloud computing space amidst current market fluctuations.
Fibonacci Analysis
| Detail | Value |
|---|---|
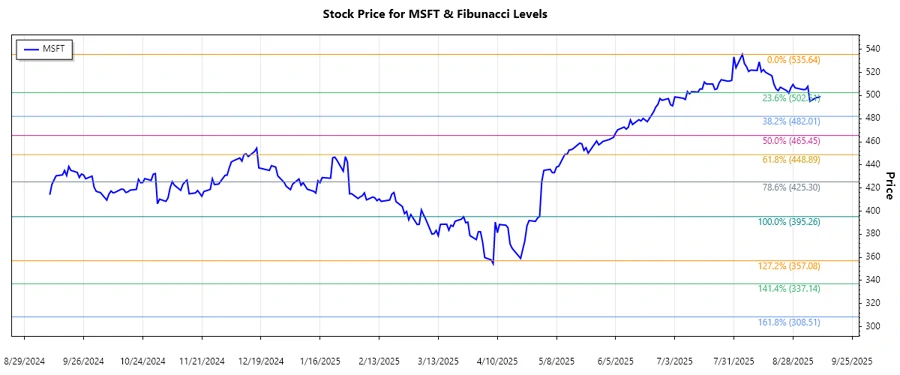
| Trend Start Date | 2024-09-10 |
| Trend End Date | 2025-09-10 |
| High Price | 535.64 on 2025-08-04 |
| Low Price | 395.26 on 2025-04-30 |
| Fibonacci Level 23.6% | 431.66 |
| Fibonacci Level 38.2% | 452.93 |
| Fibonacci Level 50.0% | 465.45 |
| Fibonacci Level 61.8% | 477.98 |
| Fibonacci Level 78.6% | 495.61 |
| Current Price Level | 499.32 |
| Current Retracement Zone | 0.786 |
| Technical Interpretation | The stock has reached the 78.6% retracement level, suggesting a significant potential support level. |
Conclusion
Analysts are facing a complex landscape with Microsoft, as recent price movements indicate potential support at key Fibonacci levels. The 78.6% retracement level could offer a critical support point if external economic factors remain stable. However, investors should remain wary of volatility, which could disrupt these technical indicators. Long-term prospects remain strong due to Microsoft's leadership in cloud technology and enterprise solutions. Short-term risks exist, thus diversification and caution are advisable. Monitoring economic policies and industry developments will be essential for future assessments.
Smart Data Insight
Master the Perfect Entry & Exit for this Stock
Don't leave your profits to chance. Historically, this stock follows specific seasonal patterns that institutional traders use to maximize returns.
- ✅ Identify the "Golden Buying Window"
- ✅ Avoid high-risk correction cycles
- ✅ Backtested data from the last 20+ years