
July 22, 2026 a 12:46 pm
MSFT: Dividend Analysis - Microsoft Corporation
Microsoft Corporation, a titan in the technology sector, exhibits a consistent dividend history with substantial growth. Its financial metrics highlight stability and a strong market cap, indicating resilience and potential for sustained shareholder returns.
Overview 📊
The overview assesses Microsoft's sector and dividend metrics to evaluate its financial health and potential as an income-generating asset.
| Attribute | Details |
|---|---|
| Sector | Technology |
| Dividend Yield | 0.92% |
| Current Dividend Per Share | 3.24 USD |
| Dividend History | 24 years |
| Last Cut or Suspension | None |
Dividend History 📈
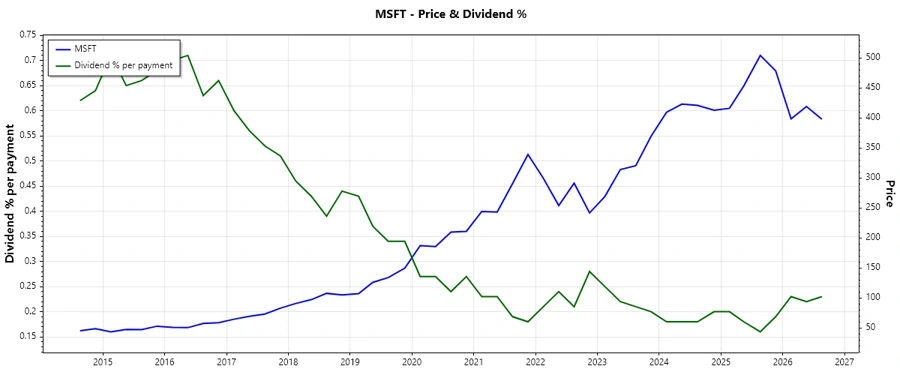
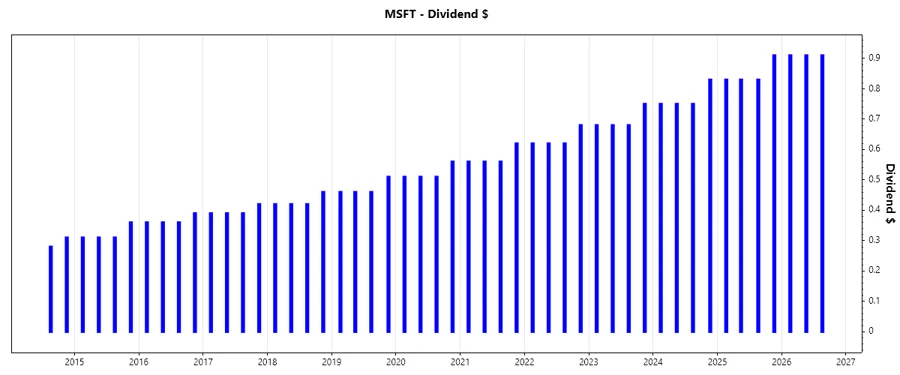
The dividend history provides insight into Microsoft’s ability to consistently return capital to shareholders over time, underscoring its commitment to dividend payments and financial stability.
| Year | Dividend Per Share |
|---|---|
| 2026 | 2.73 |
| 2025 | 3.40 |
| 2024 | 3.08 |
| 2023 | 2.79 |
| 2022 | 2.54 |
Dividend Growth 📉
The importance of dividend growth reflects Microsoft’s potential for increasing dividends, which can enhance investor returns over time.
| Time | Growth |
|---|---|
| 3 years | 10.21% |
| 5 years | 10.22% |
The average dividend growth is 10.22% over 5 years. This shows moderate but steady dividend growth.
Payout Ratio ✅
Payout ratios are key indicators of dividend sustainability, reflecting the proportion of earnings and cash flows distributed as dividends.
| Key Figure | Ratio |
|---|---|
| EPS-based | 19.21% |
| Free Cash Flow-based | 33.01% |
With an EPS-based payout ratio of 19.21% and a FCF-based ratio of 33.01%, Microsoft demonstrates a conservative approach to dividends, ensuring adequate reserves for growth and innovation.
Cashflow & Capital Efficiency
Analysis of cash flow metrics and capital efficiency reveals Microsoft’s ability to fund dividends and reinvest in business operations sustainably.
| Year | 2023 | 2024 | 2025 |
|---|---|---|---|
| Free Cash Flow Yield | 2.35% | 2.18% | 1.94% |
| Earnings Yield | 2.85% | 2.60% | 2.75% |
| CAPEX to Operating Cash Flow | 32.09% | 37.52% | 47.41% |
| Stock-based Compensation to Revenue | 4.54% | 4.38% | 4.25% |
| Free Cash Flow / Operating Cash Flow Ratio | 67.91% | 62.48% | 52.59% |
Microsoft's cash flow metrics have remained robust, with a strong free cash flow yield. This reflects the company's efficient capital management and ability to support consistent dividend payments.
Balance Sheet & Leverage Analysis
Evaluation of the balance sheet and leverage metrics provides insight into Microsoft’s financial stability and capacity to manage debt.
| Year | 2023 | 2024 | 2025 |
|---|---|---|---|
| Debt-to-Equity | 38.52% | 36.45% | 32.66% |
| Debt-to-Assets | 19.28% | 19.11% | 18.12% |
| Debt-to-Capital | 27.81% | 26.71% | 24.62% |
| Net Debt to EBITDA | 0.43 | 0.60 | 0.51 |
| Current Ratio | 1.77 | 1.27 | 1.35 |
| Quick Ratio | 1.75 | 1.27 | 1.35 |
| Financial Leverage | 199.77% | 190.77% | 180.22% |
Microsoft maintains strong liquidity with favorable leverage ratios, indicating prudent financial management and a solid foundation for financial commitments.
Fundamental Strength & Profitability
Fundamental metrics such as return ratios and profit margins reveal Microsoft’s efficient operations and competitive advantage in its sector.
| Year | 2023 | 2024 | 2025 |
|---|---|---|---|
| Return on Equity | 35.09% | 32.83% | 29.65% |
| Return on Assets | 17.56% | 17.21% | 16.45% |
| Net Margin | 34.15% | 35.96% | 36.15% |
| EBIT Margin | 43.07% | 45.17% | 44.73% |
| EBITDA Margin | 49.61% | 54.26% | 56.85% |
| Gross Margin | 68.92% | 69.76% | 68.82% |
| R&D to Revenue | 12.83% | 12.04% | 11.53% |
Microsoft achieves strong profitability across all metrics, driven by efficient operational strategies and substantial investment in research and development.
Price Development
Dividend Scoring System 🏆
| Category | Score | Rating |
|---|---|---|
| Dividend Yield | 2 | |
| Dividend Stability | 5 | |
| Dividend Growth | 4 | |
| Payout Ratio | 5 | |
| Financial Stability | 5 | |
| Dividend Continuity | 5 | |
| Cashflow Coverage | 4 | |
| Balance Sheet Quality | 5 |
Total Score: 35/40
Rating 🗣️
Microsoft Corporation is a financially robust entity with a consistent and growing dividend profile. Its strategic management of capital and resources places it at the forefront of reliable dividend-paying stocks. Based on our analysis, Microsoft’s stock is highly recommended for investors seeking stability and moderate growth in dividend income.
Smart Data Insight
Master the Perfect Entry & Exit for this Stock
Don't leave your profits to chance. Historically, this stock follows specific seasonal patterns that institutional traders use to maximize returns.
- ✅ Identify the "Golden Buying Window"
- ✅ Avoid high-risk correction cycles
- ✅ Backtested data from the last 20+ years