March 01, 2026 a 03:31 pm


📊 MSFT: Dividend Analysis - Microsoft Corporation
Microsoft Corporation demonstrates a strong dividend profile with a relatively low dividend yield but consistent and moderate growth over time. With a robust history of payments and a conservative payout strategy, MSFT presents a stable dividend option for investors seeking long-term income generation. Despite its modest dividend yield, Microsoft's overall financial health and cash flow support its dividend sustainability.
🗣️ Overview
Microsoft operates in the Technology sector, offering a distinctive dividend profile characterized by stable growth and a history spanning two decades. The company’s strategic approach to dividends emphasizes sustainability, making it an attractive choice for income-focused investors.
| Attribute | Value |
|---|---|
| Sector | Technology |
| Dividend Yield | 0.87% |
| Current Dividend Per Share | $3.24 |
| Dividend History | 24 years |
| Last Cut or Suspension | None |
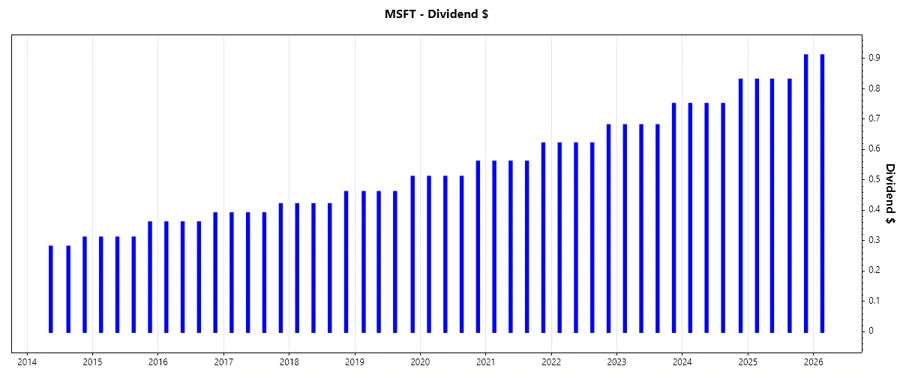
📈 Dividend History
Consistency in dividend distribution is a hallmark of Microsoft's financial strategy. For 24 years, dividends have been a reliable income stream, reinforcing the company's dedication to shareholder returns.
| Year | Dividend Per Share (USD) |
|---|---|
| 2026 | 0.91 |
| 2025 | 3.40 |
| 2024 | 3.08 |
| 2023 | 2.79 |
| 2022 | 2.54 |
📈 Dividend Growth
With consistent growth rates of approximately 10% over three and five years, Microsoft's dividend growth reflects a commitment to enhancing shareholder value through increasing returns.
| Time | Growth |
|---|---|
| 3 years | 10.21% |
| 5 years | 10.22% |
The average dividend growth is 10.22% over 5 years. This shows moderate but steady dividend growth.
⚠️ Payout Ratio
Microsoft maintains a prudent payout ratio, ensuring dividends are sustainably covered by both earnings and free cash flow, thus prioritizing financial resilience.
| Key Figure | Ratio |
|---|---|
| EPS-based | 20.19% |
| Free cash flow-based | 31.08% |
With an EPS-based payout ratio at 20.19% and a free cash flow-based ratio at 31.08%, Microsoft's dividends are well-supported by its financial performance, minimizing concerns over sustainability.
🤑 Cashflow & Capital Efficiency
Evaluating cash flow metrics, Microsoft demonstrates solid free cash flow generation and capital efficiency, underlining its ability to sustain dividend payouts.
| Year | 2023 | 2024 | 2025 |
|---|---|---|---|
| Free Cash Flow Yield | 2.35% | 2.18% | 1.94% |
| Earnings Yield | 2.85% | 2.60% | 2.75% |
| CAPEX to Operating Cash Flow | 32.09% | 37.52% | 47.41% |
| Stock-based Compensation to Revenue | 4.54% | 4.38% | 4.25% |
| Free Cash Flow / Operating Cash Flow Ratio | 67.91% | 62.48% | 52.59% |
Microsoft's cash flow metrics confirm its robust financial framework, efficiently converting revenue into free cash flow and ensuring capital is effectively deployed.
📊 Balance Sheet & Leverage Analysis
Microsoft's balance sheet shows a conservative leverage profile, with debt levels managed prudently, securing financial stability and operational flexibility.
| Year | 2023 | 2024 | 2025 |
|---|---|---|---|
| Debt-to-Equity | 0.29 | 0.25 | 0.18 |
| Debt-to-Assets | 0.15 | 0.13 | 0.10 |
| Debt-to-Capital | 0.23 | 0.20 | 0.15 |
| Net Debt to EBITDA | 0.24 | 0.37 | 0.19 |
| Current Ratio | 1.77 | 1.27 | 1.35 |
| Quick Ratio | 1.75 | 1.27 | 1.35 |
| Financial Leverage | 2.00 | 1.91 | 1.80 |
Microsoft's leverage metrics portray a disciplined approach to borrowing, ensuring its capital structure supports consistent business operations and growth.
✅ Fundamental Strength & Profitability
Strong returns and margins signify Microsoft's ability to generate profits efficiently, supporting ongoing investment in innovation and shareholder returns.
| Year | 2023 | 2024 | 2025 |
|---|---|---|---|
| Return on Equity | 35.09% | 32.83% | 29.65% |
| Return on Assets | 17.56% | 17.21% | 16.45% |
| Net Margin | 34.15% | 35.96% | 36.15% |
| EBIT Margin | 43.07% | 45.17% | 44.73% |
| EBITDA Margin | 49.61% | 54.26% | 56.85% |
| Gross Margin | 68.92% | 69.76% | 68.82% |
| Research & Development to Revenue | 12.83% | 12.04% | 11.53% |
Microsoft's profitability ratios enhance its reputation as a solid investment by delivering impressive returns and sustaining critical business functions like R&D.
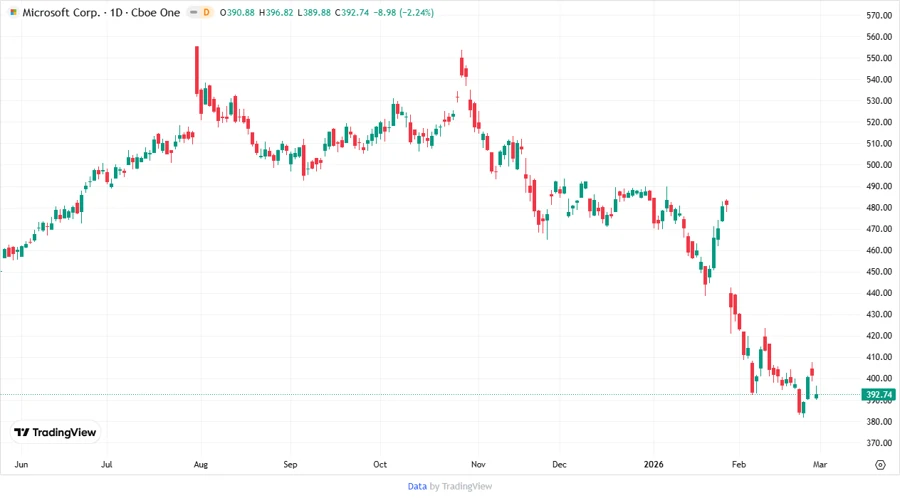
📉 Price Development
📊 Dividend Scoring System
| Category | Score | Score Bar |
|---|---|---|
| Dividend Yield | 2 | |
| Dividend Stability | 5 | |
| Dividend Growth | 4 | |
| Payout Ratio | 5 | |
| Financial Stability | 5 | |
| Dividend Continuity | 5 | |
| Cashflow Coverage | 4 | |
| Balance Sheet Quality | 5 |
Overall Score: 35/40
🎖️ Rating
Microsoft Corporation receives a robust rating owing to its outstanding financial health and reliable dividend growth history. Despite a lower dividend yield, the company is ideal for investors focusing on stable income supported by a solid balance sheet and strong cash flow.
Smart Data Insight
Master the Perfect Entry & Exit for this Stock
Don't leave your profits to chance. Historically, this stock follows specific seasonal patterns that institutional traders use to maximize returns.
- ✅ Identify the "Golden Buying Window"
- ✅ Avoid high-risk correction cycles
- ✅ Backtested data from the last 20+ years