November 02, 2025 a 07:31 am

MSFT: Dividend Analysis - Microsoft Corporation
Microsoft Corporation has showcased a steady dividend growth profile over the years, reinforcing its commitment to returning value to shareholders. Despite a moderate dividend yield, the company's financial stability and growth prospects render it a compelling investment for income-focused investors.
📊 Overview
Microsoft, a prominent player in the technology sector, demonstrates robust dividend characteristics supported by its consistent growth history.
| Metric | Details |
|---|---|
| Sector | Technology |
| Dividend yield | 0.66% |
| Current dividend per share | $3.24 |
| Dividend history | 23 years |
| Last cut or suspension | 2005 |
🗣️ Dividend History
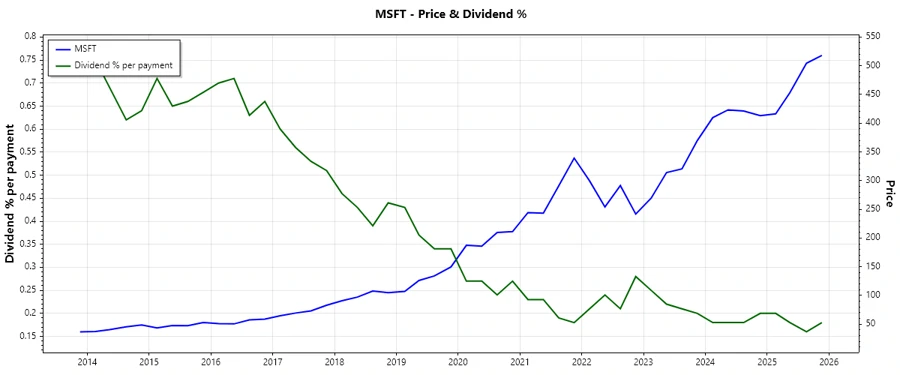
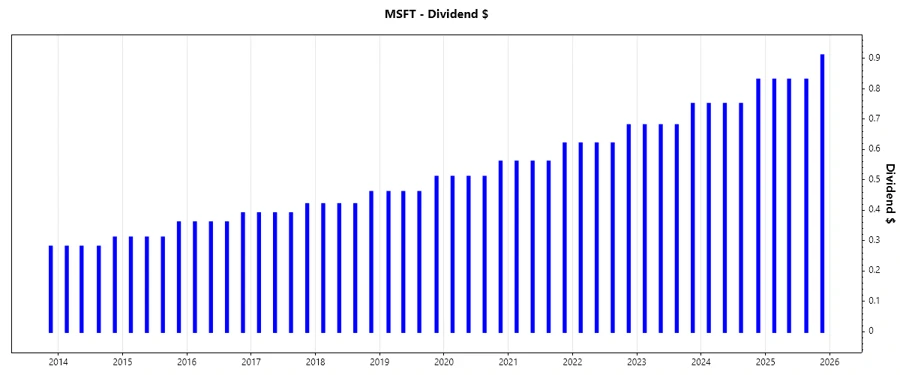
The dividend history of Microsoft displays a consistent increase in dividend payments, a testament to its financial durability and shareholder value maximization. This offers reliability and predictability to dividend-seeking investors.
| Year | Dividend per Share (USD) |
|---|---|
| 2025 | $3.40 |
| 2024 | $3.08 |
| 2023 | $2.79 |
| 2022 | $2.54 |
| 2021 | $2.30 |
📈 Dividend Growth
The robust growth in dividends over the past few years demonstrates Microsoft's commitment to increasing shareholder returns year-on-year. This trend underpins confidence in sustained financial health and profitability.
| Time | Growth |
|---|---|
| 3 years | 10.22% |
| 5 years | 10.26% |
The average dividend growth is 10.26% over 5 years. This shows moderate but steady dividend growth.
⚠️ Payout Ratio
Analyzing the payout ratios helps assess Microsoft's ability to sustain its dividend payments while maintaining enough earnings for growth.
| Key Figure | Ratio |
|---|---|
| EPS-based | 23% |
| Free cash flow-based | 31% |
The EPS payout ratio of 23% and FCF payout ratio of 31% indicate a conservative approach to dividend payments, ensuring ample liquidity for operations and future investments.
✅ Cashflow & Capital Efficiency
Examining cash flow metrics and capital efficiency ratios provides insight into Microsoft's capacity to generate cash and fund investments.
| Metric | 2023 | 2024 | 2025 |
|---|---|---|---|
| Free Cash Flow Yield | 2.35% | 2.18% | 1.94% |
| Earnings Yield | 2.85% | 2.60% | 2.75% |
| CAPEX to Operating Cash Flow | 32.09% | 37.52% | 47.41% |
| Stock-based Compensation to Revenue | 4.54% | 4.38% | 4.25% |
| Free Cash Flow / Operating Cash Flow Ratio | 67.91% | 62.48% | 52.59% |
The solid free cash flow yield indicates sound financial health, enabling the firm to cover dividend payments and invest in growth opportunities.
📉 Balance Sheet & Leverage Analysis
The balance sheet analysis with leverage ratios helps investors understand Microsoft's financial solidity and debt management strategy.
| Metric | 2023 | 2024 | 2025 |
|---|---|---|---|
| Debt-to-Equity | 29.08% | 25.00% | 17.64% |
| Debt-to-Assets | 14.56% | 13.11% | 9.79% |
| Debt-to-Capital | 22.53% | 20.00% | 14.99% |
| Net Debt to EBITDA | 24.03% | 36.70% | 18.95% |
| Current Ratio | 1.77 | 1.27 | 1.35 |
| Quick Ratio | 1.75 | 1.27 | 1.35 |
| Financial Leverage | 199.77% | 190.77% | 180.22% |
Microsoft's low leverage and strong liquidity ratios imply a robust position to weather financial storms and take advantage of growth opportunities.
📈 Fundamental Strength & Profitability
Examining profitability and fundamental strength underscores Microsoft's long-term sustainability and its strategic prowess in capital allocation.
| Metric | 2023 | 2024 | 2025 |
|---|---|---|---|
| Return on Equity | 35.09% | 32.83% | 29.65% |
| Return on Assets | 17.56% | 17.21% | 16.45% |
| Net Margin | 34.15% | 35.96% | 36.15% |
| EBIT Margin | 43.07% | 45.17% | 44.73% |
| EBITDA Margin | 49.61% | 54.26% | 56.85% |
| Gross Margin | 68.92% | 69.76% | 68.82% |
| R&D to Revenue | 12.83% | 12.04% | 11.53% |
Microsoft's strong return metrics highlight its operational efficiency and ability to generate substantial shareholder returns.
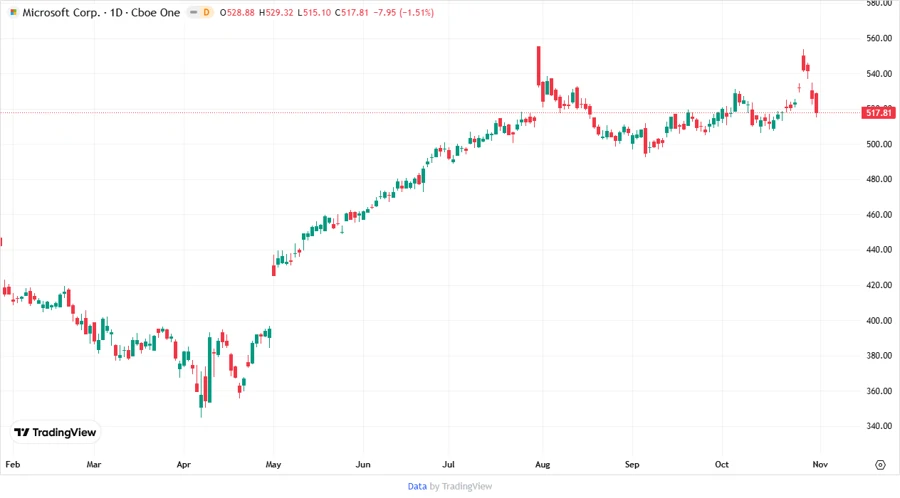
🔍 Price Development
🎯 Dividend Scoring System
| Category | Score | Bar |
|---|---|---|
| Dividend yield | 3 | |
| Dividend Stability | 5 | |
| Dividend growth | 4 | |
| Payout ratio | 5 | |
| Financial stability | 5 | |
| Dividend continuity | 5 | |
| Cashflow Coverage | 4 | |
| Balance Sheet Quality | 5 |
Total Score: 36 out of 40
👍 Rating
Microsoft Corporation presents itself as a formidable option for dividend investors, displaying strong dividend stability and growth potential. Moreover, its broad financial performance indicates an excellent capacity to sustain and enhance shareholder value. As such, it receives a high recommendation for those seeking a blend of moderate income and potential for capital appreciation.
Smart Data Insight
Master the Perfect Entry & Exit for this Stock
Don't leave your profits to chance. Historically, this stock follows specific seasonal patterns that institutional traders use to maximize returns.
- ✅ Identify the "Golden Buying Window"
- ✅ Avoid high-risk correction cycles
- ✅ Backtested data from the last 20+ years