August 23, 2025 a 07:47 am


MSFT: Dividend Analysis - Microsoft Corporation
Microsoft Corporation exhibits a modest dividend yield with a strong history of dividend growth. The company has maintained a consistent dividend payment over 23 years, making it an attractive choice for dividend-focused investors seeking stability in a tech titan.
📊 Overview
Microsoft falls under the technology sector with a current dividend yield of 0.66%. The corporation's dividend history spans an impressive 23 years, demonstrating stability in payouts. Most notably, it hasn't experienced a cut or suspension in its dividends recently, ensuring dependability for income-oriented investors.
| Metric | Details |
|---|---|
| Sector | Technology |
| Dividend yield | 0.66% |
| Current dividend per share | 3.24 USD |
| Dividend history | 23 years |
| Last cut or suspension | None |
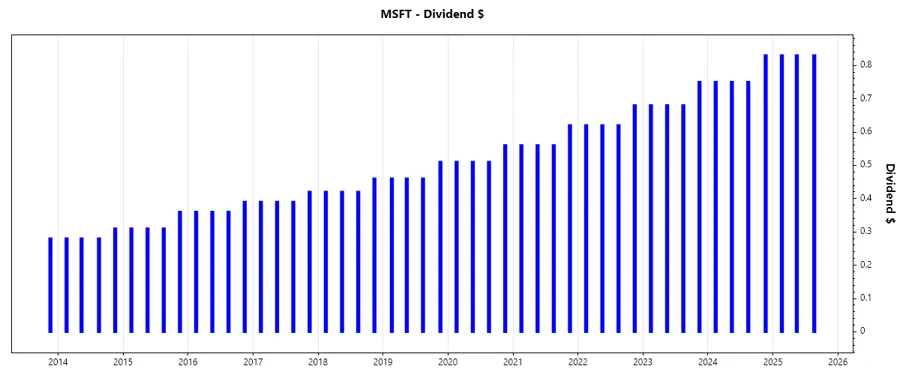
🗣️ Dividend History
Microsoft’s dividend history is a testament to its commitment to rewarding shareholders. Over the years, this steady increase in dividends provides investors with a reliable income stream and reflects the company’s robust financial health.
| Year | Dividend per Share (USD) |
|---|---|
| 2025 | 2.49 |
| 2024 | 3.08 |
| 2023 | 2.79 |
| 2022 | 2.54 |
| 2021 | 2.30 |
📈 Dividend Growth
Examining Microsoft's dividend growth reveals a consistent pattern of upward movement. Over the past 5 years, the company has sustained an average growth rate of approximately 10.26%, indicative of its strong financial posture and operational success.
| Time | Growth |
|---|---|
| 3 years | 10.22% |
| 5 years | 10.26% |
The average dividend growth is 10.26% over 5 years. This shows moderate but steady dividend growth.
✅ Payout Ratio
The payout ratio offers insights into how much profit a company returns to shareholders. Microsoft has kept its EPS-based payout ratio at 23.65% and a free cash flow-based payout ratio of 33.63%, showcasing a balanced approach to rewarding shareholders while retaining sufficient capital for growth.
| Key Figure | Ratio |
|---|---|
| EPS-based | 23.65% |
| Free cash flow-based | 33.63% |
The current payout ratios demonstrate healthy balance, with enough earnings reinvested for future growth while providing stable dividends.
⚖️ Cashflow & Capital Efficiency
Analyzing cash flows and capital efficiency is crucial to understanding a company's operational efficiency and financial health. Microsoft showcases strong free cash flow and earnings yield, supporting its expansive research and development efforts.
| Year | 2025 | 2024 | 2023 |
|---|---|---|---|
| Free Cash Flow Yield | 1.94% | 2.18% | 2.35% |
| Earnings Yield | 2.75% | 2.60% | 2.85% |
| CAPEX to Operating Cash Flow | 0.47% | 0.38% | 0.32% |
| Stock-based Comp. to Revenue | 4.25% | 4.38% | 4.54% |
| Free Cash Flow / Operating Cash Flow Ratio | 52.59% | 62.48% | 67.91% |
Microsoft's cash flow metrics underline its robust financial health, providing ample liquidity and efficient capital use.
🔍 Balance Sheet & Leverage Analysis
A robust balance sheet and prudent leverage ensuring operational flexibility and financial stability are imperative for company endurance. Microsoft's wide range of measures, including debt-to-equity and leverage ratios, signify a stable financial footing.
| Year | 2025 | 2024 | 2023 |
|---|---|---|---|
| Debt-to-Equity | 0.33 | 0.25 | 0.29 |
| Debt-to-Assets | 0.18 | 0.13 | 0.15 |
| Debt-to-Capital | 0.25 | 0.20 | 0.23 |
| Net Debt to EBITDA | 0.19 | 0.37 | 0.24 |
| Current Ratio | 1.35 | 1.27 | 1.77 |
| Quick Ratio | 1.35 | 1.27 | 1.75 |
| Financial Leverage | 1.80 | 1.91 | 1.99 |
Microsoft's leverage and financial ratios illustrate a careful balance of debts and assets, underpinning a strong balance sheet.
📉 Fundamental Strength & Profitability
Reviewing fundamentals like profitability and efficiency ratios offers comprehensive insights into the fiscal strength of a company. High margins and returns emphasize Microsoft's capability to generate substantial profits from operations.
| Year | 2025 | 2024 | 2023 |
|---|---|---|---|
| Return on Equity | 32.44% | 32.83% | 35.09% |
| Return on Assets | 16.45% | 17.21% | 17.56% |
| Net Margin | 36.15% | 35.96% | 34.15% |
| EBIT Margin | 44.73% | 45.17% | 43.07% |
| EBITDA Margin | 56.85% | 54.26% | 49.61% |
| Gross Margin | 68.82% | 69.76% | 68.92% |
| R&D to Revenue | 11.53% | 12.04% | 12.83% |
Microsoft demonstrates robust profitability with consistent returns and efficient cost management, enhancing its investment appeal.
📊 Price Development
✔️ Dividend Scoring System
| Criteria | Score | Score Bar |
|---|---|---|
| Dividend yield | 4 | |
| Dividend Stability | 5 | |
| Dividend growth | 4 | |
| Payout ratio | 5 | |
| Financial stability | 5 | |
| Dividend continuity | 5 | |
| Cashflow Coverage | 4 | |
| Balance Sheet Quality | 5 |
Total Score: 37/40
Final Rating
Microsoft Corporation showcases an exceptionally strong dividend profile, marked by stability, growth, and prudent financial management. With a high dividend scoring, it stands as a recommended investment for those seeking reliability and potential income growth. Firm’s well-balanced payout, coupled with solid cash flows and profitability, positions it as a commendable choice in a modern investment portfolio.
Smart Data Insight
Master the Perfect Entry & Exit for this Stock
Don't leave your profits to chance. Historically, this stock follows specific seasonal patterns that institutional traders use to maximize returns.
- ✅ Identify the "Golden Buying Window"
- ✅ Avoid high-risk correction cycles
- ✅ Backtested data from the last 20+ years