August 07, 2025 a 03:31 am

MSFT: Dividend Analysis - Microsoft Corporation
📊 Microsoft Corporation, having a market capitalization of approximately $3.9 trillion, demonstrates a consistent dividend-paying track record with over 23 years of history. With a modest dividend yield of 0.63%, the company maintains a conservative but stable payout strategy underpinned by strong financial metrics.
📊 Overview
Microsoft operates within the Technology sector, offering a diversified range of software, services, and hardware products globally.
| Detail | Value |
|---|---|
| Sector | Technology |
| Dividend Yield | 0.63 % |
| Current Dividend per Share | 3.24 USD |
| Dividend History | 23 years |
| Last Cut or Suspension | None |
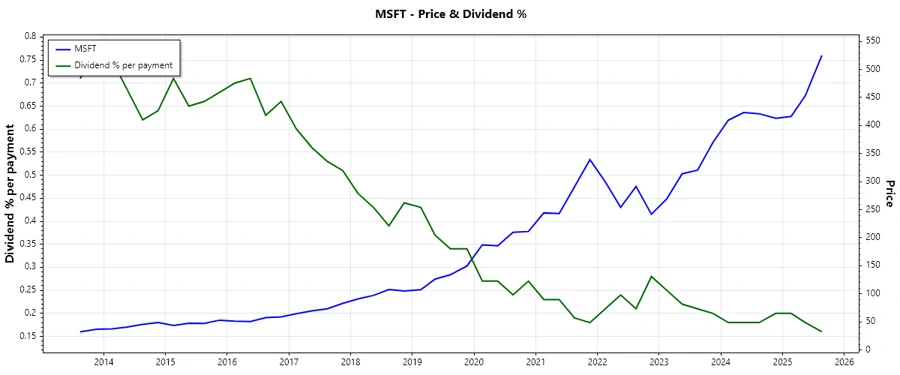
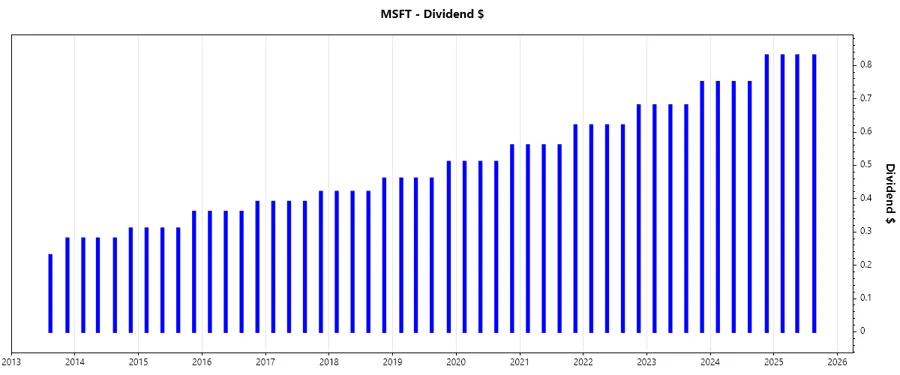
📈 Dividend History
The longevity of Microsoft’s dividend history underscores its commitment to returning value to shareholders. Sustained by robust financial health, the firm showcases resilience and dependable growth.
| Year | Dividend per Share (USD) |
|---|---|
| 2025 | 2.49 |
| 2024 | 3.08 |
| 2023 | 2.79 |
| 2022 | 2.54 |
| 2021 | 2.30 |
📉 Dividend Growth
Diversification in Microsoft's dividend strategy is evident through its moderate growth performance, indicating a pragmatic yet confident approach to escalation.
| Time | Growth |
|---|---|
| 3 years | 10.22 % |
| 5 years | 10.25 % |
The average dividend growth is 10.25% over 5 years. This shows moderate but steady dividend growth.
✅ Payout Ratio
Payout ratios offer insight into Microsoft’s sustainable dividend strategy, serving as a parameter for reinforcement of fiscal health and shareholder return.
| Key figure | Ratio |
|---|---|
| EPS-based | 23.65 % |
| Free cash flow-based | 33.63 % |
The payout ratios are within healthy limits, illustrating a conservative approach, with EPS-based at 23.65% and FCF-based at 33.63%, maintaining a buffer for reinvestment or de-leveraging.
Cashflow & Capital Efficiency
Microsoft's cash flow indicators signify robust operational efficiency and judicious capital deployment, providing confidence in its dividend stability.
| Metric | 2023 | 2024 | 2025 |
|---|---|---|---|
| Free Cash Flow Yield | 2.35 % | 2.18 % | 1.94 % |
| Earnings Yield | 2.85 % | 2.60 % | 2.75 % |
| CAPEX to Operating Cash Flow | 0.32 | 0.37 | 0.47 |
| Stock-based Compensation to Revenue | 4.54 % | 4.37 % | 4.25 % |
| Free Cash Flow / Operating Cash Flow Ratio | 0.68 | 0.62 | 0.52 |
These metrics reflect the efficiency and potential growth opportunities, with returns on invested capital emphasizing reinvestment potential and minimized capital expenditure impact.
Balance Sheet & Leverage Analysis
Exploring Microsoft’s leverage ratios illuminates its strong capital structure and risk management aptitude, imperatively safeguarding fiscal health amidst dynamic market conditions.
| Metric | 2023 | 2024 | 2025 |
|---|---|---|---|
| Debt-to-Equity | 0.29 | 0.25 | 0.18 |
| Debt-to-Assets | 0.15 | 0.13 | 0.10 |
| Debt-to-Capital | 0.23 | 0.20 | 0.15 |
| Net Debt to EBITDA | 0.24 | 0.37 | 0.19 |
| Current Ratio | 1.77 | 1.27 | 1.35 |
| Quick Ratio | 1.75 | 1.27 | 1.35 |
| Financial Leverage | 2.00 | 1.91 | 1.80 |
Microsoft's leverage indicators are indicative of a resilient financial foundation, providing a strong position to withstand economic volatilities and pursue strategic opportunities.
Fundamental Strength & Profitability
Unveiling profitability metrics allows investors a criterion gauge of Microsoft’s operational prowess and strategic alignment towards maximizing shareholder returns.
| Metric | 2023 | 2024 | 2025 |
|---|---|---|---|
| Return on Equity | 35.09 % | 32.83 % | 29.65 % |
| Return on Assets | 17.56 % | 17.21 % | 16.45 % |
| Margins: Net | 34.15 % | 35.96 % | 36.15 % |
| Margins: EBIT | 43.07 % | 45.17 % | 44.73 % |
| Margins: EBITDA | 49.61 % | 54.26 % | 56.85 % |
| Margins: Gross | 68.92 % | 69.76 % | 68.82 % |
| Research & Development to Revenue | 12.83 % | 12.04 % | 11.53 % |
Such profitability metrics emphasize a solid competitive position and the capability to convert revenue into actual profits, ensuring dividends are not just sustainable but capable of growth.
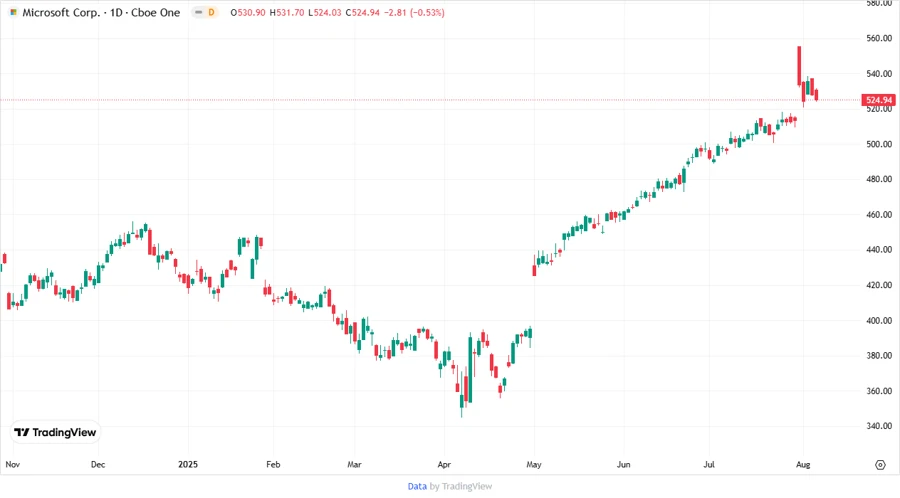
Price Development
Dividend Scoring System
| Category | Score | Score |
|---|---|---|
| Dividend Yield | 2 | |
| Dividend Stability | 5 | |
| Dividend Growth | 4 | |
| Payout Ratio | 5 | |
| Financial Stability | 5 | |
| Dividend Continuity | 5 | |
| Cashflow Coverage | 4 | |
| Balance Sheet Quality | 5 |
Overall Score: 35/40
🗣️ Rating
Microsoft Corporation exhibits a formidable dividend profile indicative of prudent financial management and robust growth potential. With demonstrated dividend stability and consistent growth, Microsoft is suitable for investors valuing reliability and moderate income appreciation. Its strong financial foundation supports strategic flexibility and resilient shareholder returns, making it an attractive investment for long-term value seekers.
Smart Data Insight
Master the Perfect Entry & Exit for this Stock
Don't leave your profits to chance. Historically, this stock follows specific seasonal patterns that institutional traders use to maximize returns.
- ✅ Identify the "Golden Buying Window"
- ✅ Avoid high-risk correction cycles
- ✅ Backtested data from the last 20+ years