April 13, 2026 a 09:03 am
MSCI: Trend and Support & Resistance Analysis - MSCI Inc.
MSCI Inc. stands as a pivotal player in the investment decision support sector, offering a diverse array of tools across its four segments. Given its expansive reach in index creation, risk assessment, and ESG criteria integration, the company's stocks have gained significant attention. Recent market data provides valuable insights into the stock's technical position, helping traders and analysts make informed decisions.
Trend Analysis
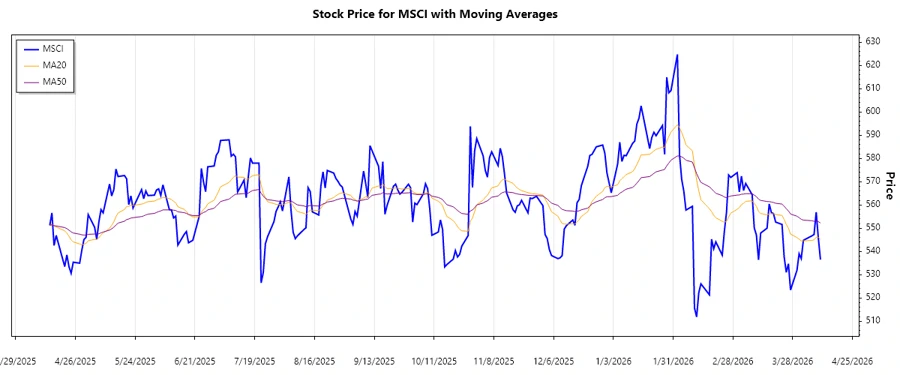
The analysis of MSCI's stock data reveals a notable trend in the past months. The price has experienced fluctuations, showing signs of stabilization with some bullish undertones recently. Calculating the EMA20 and EMA50 serves as a crucial indicator of the current trend.
| Date | Closing Price | Trend |
|---|---|---|
| 2026-04-10 | $536.48 | ▼ |
| 2026-04-09 | $545.88 | ▼ |
| 2026-04-08 | $556.93 | ▲ |
| 2026-04-07 | $547.28 | ▲ |
| 2026-04-06 | $546.71 | ▲ |
| 2026-04-02 | $544.78 | ▲ |
| 2026-04-01 | $536.90 | ▲ |
The EMA analysis indicates an emerging upward trend, particularly with short-term strength, though still under periodic downtrends.
Support and Resistance
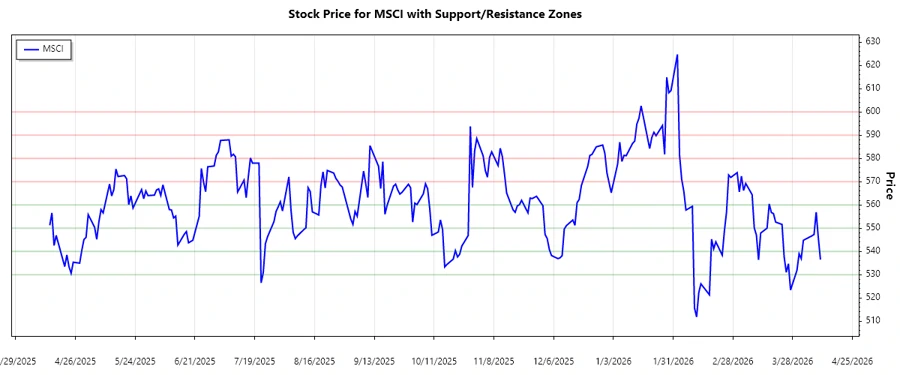
Based on historical data, key support and resistance zones have been identified. These levels provide traders insights into potential price movements and reversal points.
| Type | Level From | Level To |
|---|---|---|
| Support Zone 1 | $530.00 | $540.00 |
| Support Zone 2 | $550.00 | $560.00 |
| Resistance Zone 1 | $570.00 | $580.00 |
| Resistance Zone 2 | $590.00 | $600.00 |
The current price appears to be hovering around the lower Support Zone 2, suggesting strong buying interest at these levels.
Conclusion
MSCI Inc.'s stock displays a potential upward trajectory with reliable support holding firm. Risks involve potential retracements, but strong resistance levels above could limit substantial declines. Analysts should monitor these zones for entry and exit points to optimize trade setups. While external market factors remain influential, MSCI's robust market position aids in sustaining investor confidence.