December 04, 2025 a 09:03 am


MSCI: Trend and Support & Resistance Analysis - MSCI Inc.
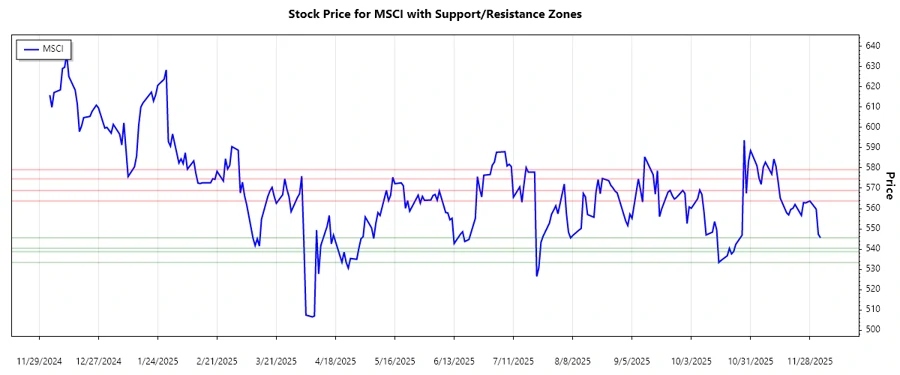
MSCI Inc. provides critical data tools and support systems for investment decisions globally. With a diversified portfolio across indexes, analytics, ESG, and private assets, MSCI aids investors in making informed decisions amidst market complexities. Analyzing recent trends helps in understanding the potential movement of MSCI's stock price and strategic levels for entry or exit.
Trend Analysis
| Date | Close | Trend |
|---|---|---|
| 2025-12-03 | $545.56 | ▼ |
| 2025-12-02 | $547.29 | ▼ |
| 2025-12-01 | $559.66 | ▼ |
| 2025-11-28 | $563.72 | ▼ |
| 2025-11-26 | $562.74 | ▼ |
| 2025-11-25 | $562.92 | ▲ |
| 2025-11-24 | $556.6 | ▼ |
The analysis indicates a downward trend in the recent period. The EMA calculations show that the EMA20 is consistently below the EMA50, confirming an overall downtrend. This suggests a cautious approach for investors focusing on potential bearish opportunities.
Support and Resistance
| Zone | Level |
|---|---|
| Support 1 | $540.36 - $545.56 |
| Support 2 | $533.34 - $538.75 |
| Resistance 1 | $563.72 - $568.9 |
| Resistance 2 | $574.58 - $579.16 |
The MSCI stock is currently trading around the support zones, indicating potential buying interest at these price levels. The support and resistance levels show significant price areas where price action may turn or stall.
Conclusion
The recent downtrend in MSCI Inc.'s stock suggests caution for bullish investors, although current support zones could offer potential buying opportunities. The technical analysis highlights the critical levels for sustained price movements. Investors should closely monitor these levels to gauge market sentiment and decide on entry or exit strategies. This analysis can guide traders in navigating the MSCI market since technical patterns often signal where the stock could move next. It's vital to remain informed of wider economic conditions that may also impact MSCI's stock valuations.