May 31, 2025 a 04:44 pmHTML

MSCI: Fibonacci Analysis - MSCI Inc.
MSCI Inc., a leader in investment decision support tools, has shown a significant trend in its recent stock performance. The company's stock experienced a considerable price movement, allowing us to perform a detailed Fibonacci analysis. Investors should consider the implications of these retracement levels as potential areas of support or resistance, indicating crucial entry or exit points.
Fibonacci Analysis
Based on the historical data over the past several months, we're observing a strong downtrend in MSCI's stock price.
| Detail | Value |
|---|---|
| Start Date | 2024-12-12 |
| End Date | 2025-05-08 |
| High Price | $635.99 (2024-12-12) |
| Low Price | $506.56 (2025-04-07) |
Fibonacci Retracement Levels
| Level | Price |
|---|---|
| 0.236 | $534.74 |
| 0.382 | $555.10 |
| 0.5 | $571.28 |
| 0.618 | $587.46 |
| 0.786 | $608.18 |
The current price of $564.02 lies in the 0.382 retracement zone, suggesting this level could act as a potential resistance.
Technically, if the stock fails to sustain above this level, it could indicate further downside potential, whereas a breakthrough might signal a reversal towards higher retracement levels.
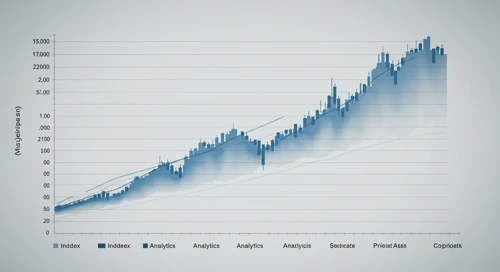
A detailed stock chart showing trends and retracement levels for MSCI Inc.
Conclusion
The analysis of MSCI Inc. reveals risks associated with its current downtrend, with retracement levels marking critical resistance points. Investors should closely monitor the stock’s movement around these levels for potential trend reversals. While a breakthrough towards higher retracement levels may signal an opportunity for gains, the stock’s inability to sustain above these points poses risks of further declines. Analysts and investors can employ this retracement analysis as part of broader strategic planning to optimize investment decisions regarding MSCI Inc.
Smart Data Insight
Master the Perfect Entry & Exit for this Stock
Don't leave your profits to chance. Historically, this stock follows specific seasonal patterns that institutional traders use to maximize returns.
- ✅ Identify the "Golden Buying Window"
- ✅ Avoid high-risk correction cycles
- ✅ Backtested data from the last 20+ years