February 09, 2026 a 03:31 am

MSCI: Dividend Analysis - MSCI Inc.
MSCI Inc. presents a nuanced dividend profile with a moderate dividend yield and steady growth over recent years. The stability in its financial ratios indicates robust management of its dividend distribution. However, attention should be paid to the relatively high debt ratios, which could impact future payouts.
📊 Overview
MSCI Inc. is positioned in the sector of finance and investment services. The current dividend yield stands at 1.34%, derived from a dividend per share of $7.21. With a dividend track record spanning 13 years and no history of recent cuts or suspensions, MSCI demonstrates consistency in its shareholder returns.
| Key Metrics | Value |
|---|---|
| Sector | Finance and Investment Services |
| Dividend Yield | 1.34% |
| Current Dividend per Share | $7.21 USD |
| Dividend History | 13 years |
| Last Cut or Suspension | None |
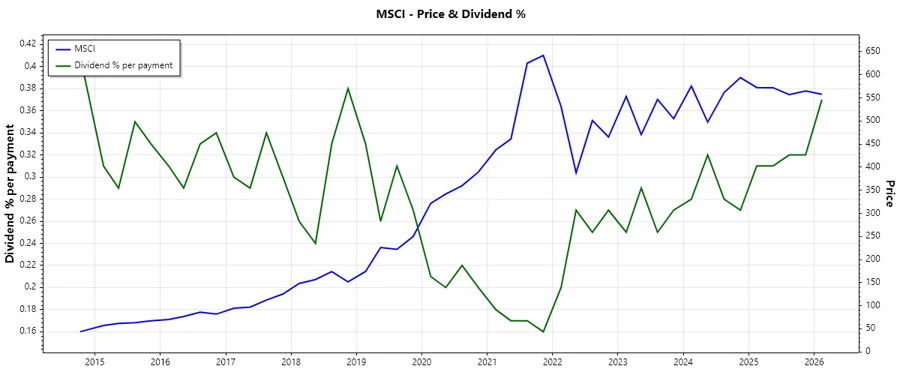
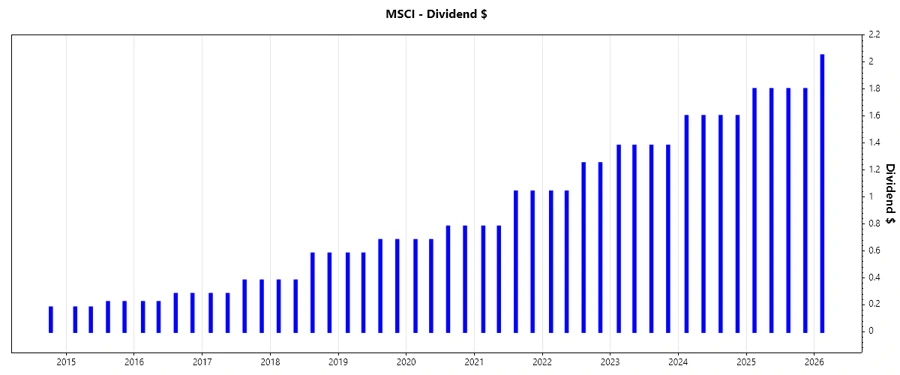
📈 Dividend History
An examination of the historical dividend payments reveals a progressive and resilient model in returning capital to shareholders. MSCI's record over the years emphasizes the importance of steady yield growth as a valuable component of total shareholder return.
| Year | Dividend Per Share (USD) |
|---|---|
| 2026 | $2.05 |
| 2025 | $7.20 |
| 2024 | $6.40 |
| 2023 | $5.52 |
| 2022 | $4.58 |
🗣️ Dividend Growth
MSCI Inc.’s dividend growth rates, 16.28% over 3 years and 19.78% over 5 years, exemplify a healthy increment in dividend distributions. This is a critical metric indicating the potential for long-term return enhancement through dividends.
| Time | Growth |
|---|---|
| 3 years | 16.28% |
| 5 years | 19.78% |
The average dividend growth is 19.78% over 5 years. This shows moderate but steady dividend growth.
⚠️ Payout Ratio
Payout ratios offer insights into a company’s ability to maintain its dividend. MSCI's EPS-based payout is 46.29%, while cash flow-based is 34.98%. These figures are within a reasonably sustainable range, providing reassurance in the continuation of dividend distributions.
| Key figure ratio | Value |
|---|---|
| EPS-based | 46.29% |
| Free cash flow-based | 34.98% |
🖊️ Cashflow & Capital Efficiency
Analyzing MSCI's cash flow and capital efficiency confirms the company's ability to translate profitability into free cash flow, critical for sustaining dividend payouts. Metrics like the FCF/OCF ratio at 97.52% and earnings yield at 2.79% reflect operational excellence. Moreover, the allocation of CAPEX remains conservative, further enhancing cash fluidity.
| Year | 2023 | 2024 | 2025 |
|---|---|---|---|
| Free Cash Flow Yield | 2.55% | 3.11% | 3.50% |
| Earnings Yield | 2.56% | 2.35% | 2.72% |
| CAPEX to Operating Cash Flow | 7.35% | 2.25% | 2.48% |
| Stock-based Compensation to Revenue | 2.83% | 3.33% | 3.55% |
| Free Cash Flow / Operating Cash Flow Ratio | 92.65% | 97.75% | 97.52% |
Overall, the company demonstrates satisfactory cash flow management and capital allocation, providing a strong backbone for continued dividend contributions.
🧮 Balance Sheet & Leverage Analysis
The assessment of leverage ratios such as debt-to-equity and net debt to EBITDA provides a glimpse into MSCI's capital structure and risk exposure. The high negative leverage ratios may point to potential risks in volatility or economic downturns. Nevertheless, with an interest coverage ratio over 8, MSCI holds solid capacity to meet interest obligations.
| Year | 2023 | 2024 | 2025 |
|---|---|---|---|
| Debt-to-Equity | -625.59% | -495.41% | -241.75% |
| Debt-to-Assets | 83.87% | 85.52% | 112.54% |
| Debt-to-Capital | 119.03% | 125.29% | 170.55% |
| Net Debt to EBITDA | 2.43 | 2.43 | 3.05 |
| Current Ratio | 0.93 | 0.85 | 0.90 |
| Quick Ratio | 0.93 | 0.85 | 0.90 |
MSCI's financial stability appears resilient despite leverage constraints, with liquidity ratios indicating decent short-term solvency.
🌱 Fundamental Strength & Profitability
The examination of profitability ratios such as ROE and net income margins uncovers insights into MSCI’s operational competence and fiscal well-being. While ROE indicates subpar returns, the company's net margins remain healthy, fortifying its profitability potential.
| Year | 2023 | 2024 | 2025 |
|---|---|---|---|
| Return on Equity | -155.26% | -117.99% | -45.29% |
| Return on Assets | 20.81% | 20.37% | 21.08% |
| Net Margin | 45.42% | 38.83% | 38.36% |
| EBIT Margin | 61.52% | 53.98% | 54.37% |
| EBITDA Margin | 67.81% | 61.20% | 61.64% |
| Gross Margin | 82.34% | 81.99% | 82.44% |
| R&D to Revenue | 5.22% | 5.56% | 5.67% |
Overall, despite negative ROE figures, the solid profitability margins and efficient cost management paint a picture of strong operational capabilities.
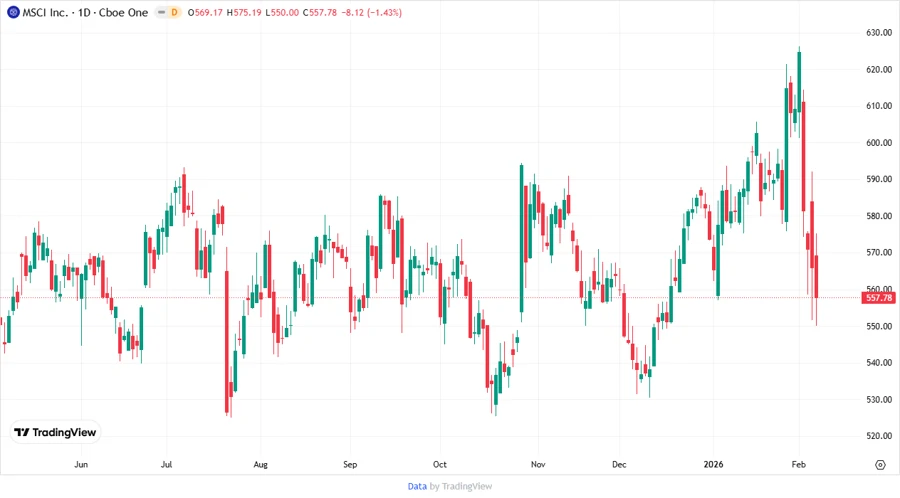
📉 Price Development
✅ Dividend Scoring System
| Criterion | Score | Score Bar |
|---|---|---|
| Dividend yield | 3 | |
| Dividend Stability | 4 | |
| Dividend growth | 4 | |
| Payout ratio | 4 | |
| Financial stability | 3 | |
| Dividend continuity | 5 | |
| Cashflow Coverage | 4 | |
| Balance Sheet Quality | 3 |
Total Score: 30/40
📣 Rating
MSCI Inc.'s overall dividend profile indicates moderate appeal to income-seeking investors, particularly those valuing consistency over high yield. The company's robust growth and solid profitability metrics, balanced by higher-than-average leverage and moderate dividend yield, advocate for a neutral stance with a potential upside as management addresses balance sheet constraints.
Smart Data Insight
Master the Perfect Entry & Exit for this Stock
Don't leave your profits to chance. Historically, this stock follows specific seasonal patterns that institutional traders use to maximize returns.
- ✅ Identify the "Golden Buying Window"
- ✅ Avoid high-risk correction cycles
- ✅ Backtested data from the last 20+ years