January 20, 2026 a 12:46 pm

📊 MSCI: Dividend Analysis - MSCI Inc.
🗣️ MSCI Inc. has demonstrated a consistent growth in its dividend payments, supported by a stable payout ratio. The company's solid track record in maintaining dividend history is indicative of its financial robustness and commitment to returning value to shareholders. Despite a modest dividend yield, the steady growth trend may appeal to long-term income-focused investors.
Overview
📝 The examination of MSCI's sector placement and dividend metrics reveals key insights into its market posture and shareholder returns.
| Metric | Value |
|---|---|
| Sector | Unknown sector data |
| Dividend yield | 1.27% |
| Current dividend per share | 6.47 USD |
| Dividend history | 12 years |
| Last cut or suspension | None |
Dividend History
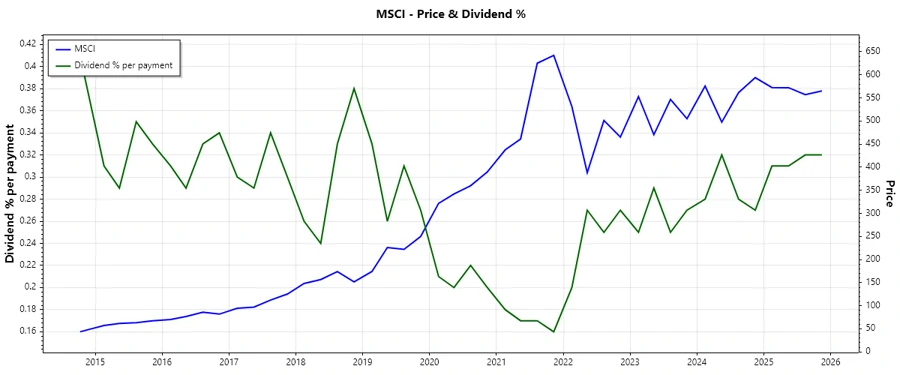
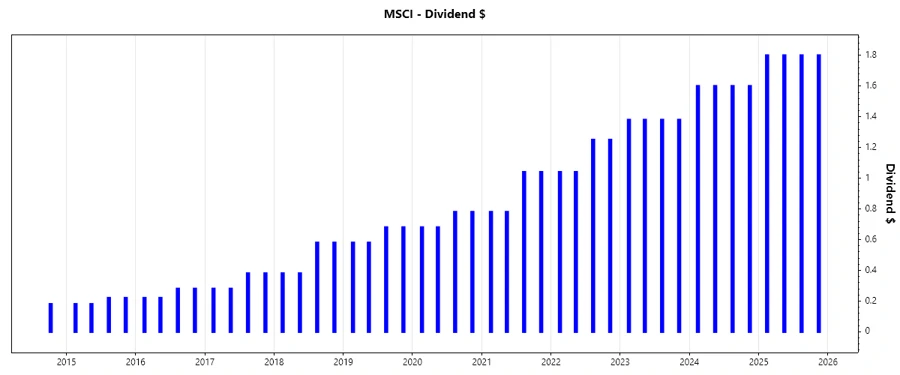
Detailed historical dividend data highlights MSCI's commitment to increasing shareholder value through consistent payouts. A stable dividend history can signal financial health and reliability to investors.
| Year | Dividend Per Share (USD) |
|---|---|
| 2025 | 7.20 |
| 2024 | 6.40 |
| 2023 | 5.52 |
| 2022 | 4.58 |
| 2021 | 3.64 |
Dividend Growth
📈 Reviewing MSCI's dividend growth rates provides insight into future yield sustainability. This metric is crucial for gauging the company's ability to enhance investor returns over time.
| Time | Growth |
|---|---|
| 3 years | 16.28% |
| 5 years | 19.78% |
The average dividend growth is 19.78% over 5 years. This shows moderate but steady dividend growth.
Payout Ratio
Analyzing the payout ratio informs investors of the portion of earnings distributed as dividends—a critical factor in ensuring the sustainability of dividend payments.
| Key figure | Ratio |
|---|---|
| EPS-based | 40.80% |
| Free cash flow-based | 33.88% |
The EPS-based payout ratio of 40.80% and FCF-based payout ratio of 33.88% indicate a conservative and sustainable dividend payout policy, ensuring investors that the company retains enough earnings for future growth initiatives.
Cashflow & Capital Efficiency
Understanding cash flow and capital efficiency metrics helps gauge a company's ability to meet its financial obligations and return capital to shareholders. This is crucial for assessing overall financial health and operational efficiency.
| Metric | 2024 | 2023 | 2022 |
|---|---|---|---|
| Free Cash Flow Yield | 3.11% | 2.55% | 2.72% |
| Earnings Yield | 2.35% | 2.56% | 2.32% |
| CAPEX to Operating Cash Flow | 2.25% | 7.35% | 6.65% |
| Stock-based Compensation to Revenue | 3.33% | 2.83% | 2.58% |
| Free Cash Flow / Operating Cash Flow Ratio | 97.75% | 92.65% | 93.35% |
The cash flow data underlines MSCI's robust operational efficiency, signifying impressive control over capital expenditures and efficient use of cash.
Balance Sheet & Leverage Analysis
Balance sheet analysis highlights financial stability and debt management practices, essential for ensuring that obligations can be met without jeopardizing operations.
| Ratio | 2024 | 2023 | 2022 |
|---|---|---|---|
| Debt-to-Equity | -4.95 | -6.26 | -4.61 |
| Debt-to-Assets | 0.86 | 0.84 | 0.93 |
| Debt-to-Capital | 1.25 | 1.19 | 1.28 |
| Net Debt to EBITDA | 2.43 | 2.43 | 2.69 |
| Current Ratio | 0.88 | 0.93 | 1.40 |
| Quick Ratio | 0.88 | 0.93 | 1.40 |
| Financial Leverage | -5.79 | -7.46 | -4.96 |
The leverage ratios indicate a significant reliance on debt financing, posing potential risks if uncontrollable. However, the current and quick ratios suggest satisfactory liquidity management.
Fundamental Strength & Profitability
Examining return metrics and margin data paints a picture of MSCI's profitability, providing cues on operational performance and shareholder value creation capabilities.
| Metric | 2024 | 2023 | 2022 |
|---|---|---|---|
| Return on Equity | -1.18 | -1.55 | -0.86 |
| Return on Assets | 0.20 | 0.21 | 0.17 |
| Net Margin | 38.83% | 45.42% | 38.72% |
| EBIT Margin | 53.98% | 61.52% | 54.05% |
| EBITDA Margin | 61.20% | 67.81% | 60.39% |
| Gross Margin | 81.99% | 82.34% | 82.02% |
| Research & Development to Revenue | 5.56% | 5.22% | 4.77% |
Although the negative return on equity raises a red flag, MSCI's impressive margins suggest strong cost management and profitability. High capital return effectiveness continues to support growth initiatives and investor rewards.
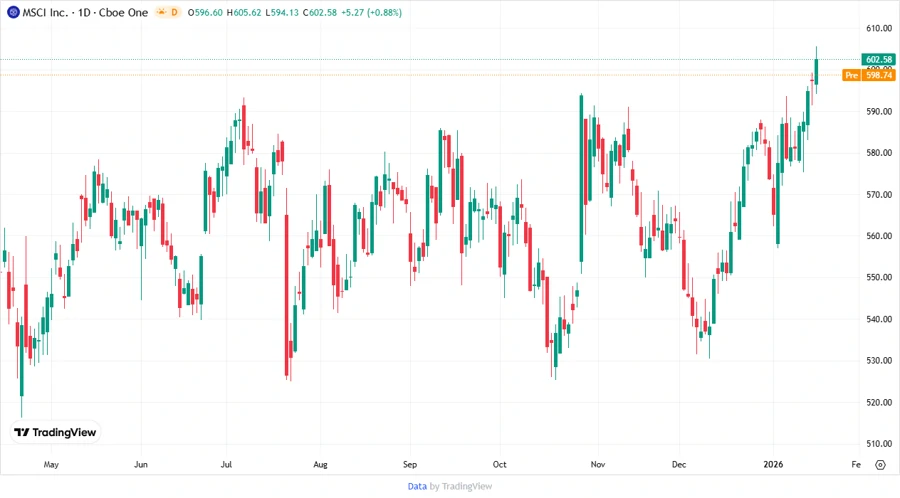
Price Development
Dividend Scoring System
| Criteria | Score | Visual |
|---|---|---|
| Dividend yield | 2 | |
| Dividend Stability | 4 | |
| Dividend Growth | 4 | |
| Payout Ratio | 4 | |
| Financial Stability | 3 | |
| Dividend Continuity | 5 | |
| Cashflow Coverage | 4 | |
| Balance Sheet Quality | 3 |
Aggregate Score: 29/40
Rating
🌟 Overall, MSCI Inc. exhibits a strong commitment to dividend growth, capital efficiency, and cash flow management. Despite certain financial leverage challenges, MSCI's strategic growth in dividends and consistent profitability make it an attractive option for income-focused investors with a tolerance for potential volatility.