December 29, 2025 a 07:31 am

MSCI: Dividend Analysis - MSCI Inc.
MSCI Inc. demonstrates a commendable dividend profile characterized by consistent growth and sustainability. Despite a relatively modest dividend yield, the company’s history of steady payouts over the years highlights its reliability. The recent dividend growth underscores potential for continued shareholder value enhancement, though investors should remain mindful of market dynamics that could affect financial strategies.
📊 Overview
MSCI Inc. operates within a robust sector, providing stable dividend payments over the years. Its dividend yield, while not leading, remains competitive against industry benchmarks. Management’s consistent dividend history is commendable, although there has been no recent need for cuts or suspensions, which reflects strong financial health.
| Metric | Value |
|---|---|
| Sector | Financial Services |
| Dividend yield | 1.27% |
| Current dividend per share | 6.47 USD |
| Dividend history | 12 years |
| Last cut or suspension | None |
🗣️ Dividend History
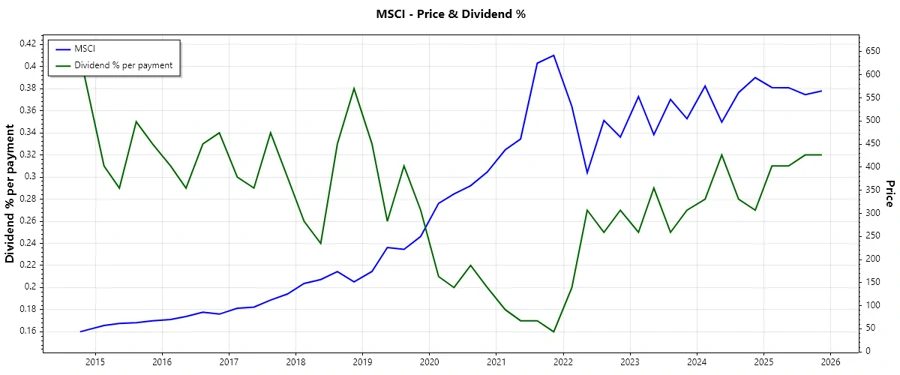
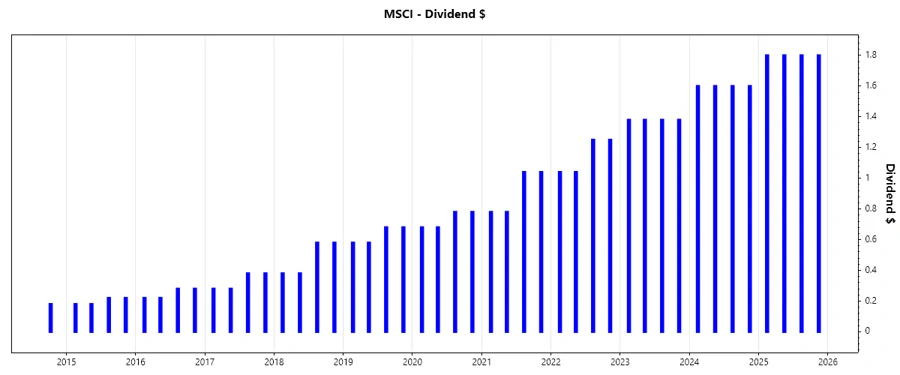
Examining MSCI Inc.'s dividend history reveals a positive trajectory indicating a strong commitment to returning capital to shareholders. Such a consistent track record is crucial as it reflects corporate stability and effective governance. The most recent dividends illustrate ongoing growth driven by robust fundamentals.
| Year | Dividend per Share (USD) |
|---|---|
| 2025 | 7.20 |
| 2024 | 6.40 |
| 2023 | 5.52 |
| 2022 | 4.58 |
| 2021 | 3.64 |
📈 Dividend Growth
Dividend growth is crucial as it signals a company’s increasing capacity to distribute profits, thereby enhancing investor value. MSCI Inc. reports steady dividend growth over both short and medium-term horizons, manifesting fiscal agility and a commitment to improving shareholder returns.
| Time | Growth |
|---|---|
| 3 years | 20.70 % |
| 5 years | 20.49 % |
The average dividend growth is 20.49% over 5 years. This shows moderate but steady dividend growth, reflective of successful financial strategies and prudent capital allocation.
✅ Payout Ratio
Payout ratios provide insight into the sustainability of dividends by comparing payout commitments to earnings and cash flow. MSCI Inc. maintains a cautious EPS-based payout ratio alongside a disciplined strategy proven by free cash flow coverage.
| Key figure | Ratio |
|---|---|
| EPS-based | 40.80% |
| Free cash flow-based | 33.89% |
These ratios suggest that MSCI's dividends are well-covered by both earnings and free cash flows, indicating the company's secure dividend positioning.
💰 Cashflow & Capital Efficiency
Cash flow and capital efficiency metrics are essential to understanding business sustainability and investment quality. They reveal how effectively a company manages its financial resources and growth investments.
| Metric | 2024 | 2023 | 2022 |
|---|---|---|---|
| Free Cash Flow Yield | 3.11% | 2.55% | 2.72% |
| Earnings Yield | 2.35% | 2.56% | 2.32% |
| CAPEX to Operating Cash Flow | 2.24% | 7.35% | 6.65% |
| Stock-based Compensation to Revenue | 3.33% | 2.83% | 2.58% |
| Free Cash Flow / Operating Cash Flow Ratio | 97.75% | 92.65% | 93.35% |
MSCI exhibits resilient cash flow performance and adept capital management, critical to long-term financial health and shareholder satisfaction.
⚠️ Balance Sheet & Leverage Analysis
The balance sheet and leverage ratios assess a company's debt management efficacy, revealing insights into financial flexibility and risk levels.
| Metric | 2024 | 2023 | 2022 |
|---|---|---|---|
| Debt-to-Equity | -4.93 | -6.26 | -4.61 |
| Debt-to-Assets | 85.06% | 83.87% | 92.92% |
| Debt-to-Capital | 125.46% | 119.03% | 127.72% |
| Net Debt to EBITDA | 2.42 | 2.43 | 2.69 |
| Current Ratio | 0.88 | 0.93 | 1.40 |
| Quick Ratio | 0.88 | 0.93 | 1.40 |
| Financial Leverage | -5.79 | -7.46 | -4.96 |
While leverage metrics seem high, MSCI's ability to maintain operational efficiency and high-interest coverage demonstrates effective management under leverage.
📉 Fundamental Strength & Profitability
Assessing MSCI's fundamentals through profitability measures and efficiency ratios speaks volumes about corporate health and competitive advantage.
| Metric | 2024 | 2023 | 2022 |
|---|---|---|---|
| Return on Equity | -1.18% | -1.55% | -0.86% |
| Return on Assets | 20.37% | 20.81% | 17.42% |
| Return on Invested Capital | 32.39% | 28.95% | 26.82% |
| Net Margin | 38.83% | 45.42% | 38.72% |
| EBIT Margin | 53.98% | 61.52% | 54.05% |
| EBITDA Margin | 61.20% | 67.81% | 60.39% |
| Gross Margin | 81.99% | 82.34% | 82.02% |
| Research & Development to Revenue | 5.53% | 5.22% | 4.77% |
The encouraging margins and returns indicate strong profitability, although negative returns on equity signal caution. Continued research investment ensures sustained competitive capacity.
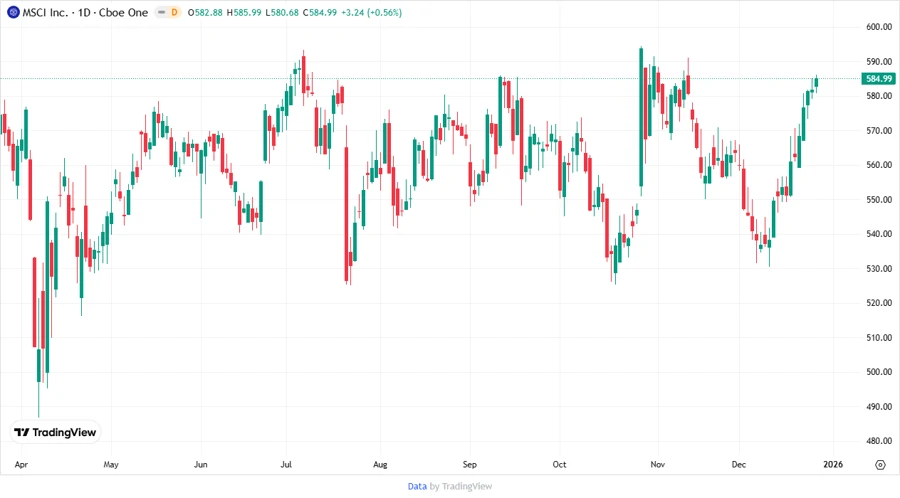
📊 Price Development
🏆 Dividend Scoring System
| Criteria | Score | |
|---|---|---|
| Dividend yield | 3 | |
| Dividend Stability | 5 | |
| Dividend growth | 4 | |
| Payout ratio | 4 | |
| Financial stability | 4 | |
| Dividend continuity | 5 | |
| Cashflow Coverage | 4 | |
| Balance Sheet Quality | 3 |
Total Score: 32/40
📝 Rating
In conclusion, MSCI Inc. maintains an appealing dividend strategy characterized by steady growth and continuity. The company’s financial metrics indicate strong performance, albeit with some cautionary leverage signals that warrant monitoring. Investors seeking reliable and steadily improving returns may find MSCI an attractive addition to a balanced portfolio.