November 14, 2025 a 03:31 pm
MSCI: Dividend Analysis - MSCI Inc.
MSCI Inc. stands out with a strong dividend track, showcasing a steady growth over recent years. With a current dividend yield at 1.26%, bolstered by a 12-year history of consistent payments and no recent suspensions, MSCI presents an appealing proposition for dividend-focused investors. The moderate payout ratios indicate a balanced approach towards dividend payments and business reinvestment, promising sustainable financial strategies.
📊 Overview
MSCI Inc. operates within the financial sector, offering an attractive dividend framework. Despite a relatively low yield compared to industry giants, at 1.26% it serves a niche market valuing stability over sheer volume. Its consistent dividend history spanning 12 years positions it as a reliable choice for investors.
| Indicator | Value |
|---|---|
| Sector | Financials |
| Dividend Yield | 1.26% |
| Current Dividend per Share | 6.47 USD |
| Dividend History | 12 years |
| Last Cut or Suspension | None |
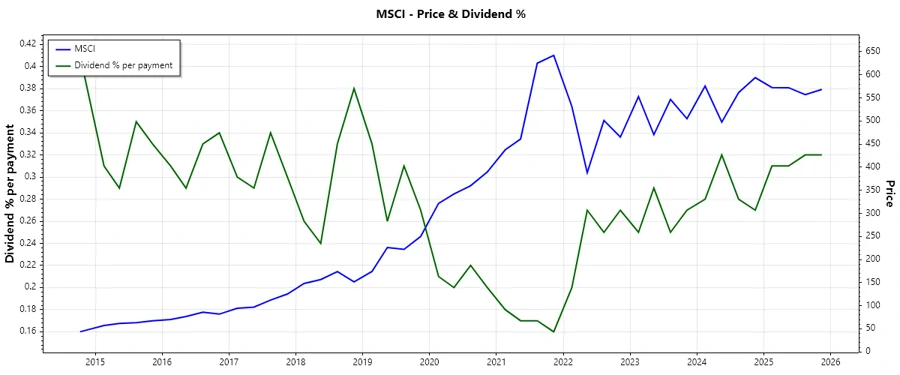
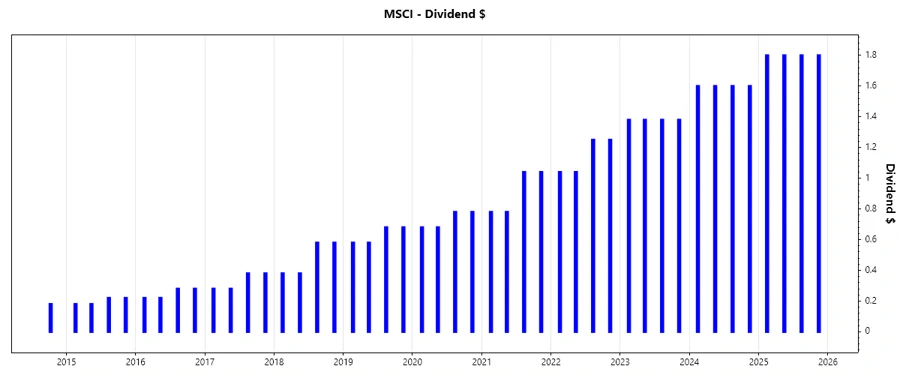
🗣️ Dividend History
The historical progression of dividends portrays MSCI's commitment to shareholder returns, with substantial increases in its per-share distribution, particularly over the last five years. This signals robust revenue growth and a positive outlook on long-term financial health, epitomizing trust in MSCI's future prospects.
| Year | Dividend per Share (USD) |
|---|---|
| 2025 | 7.20 |
| 2024 | 6.40 |
| 2023 | 5.52 |
| 2022 | 4.58 |
| 2021 | 3.64 |
📈 Dividend Growth
The progressive dividend growth, with a 20.7% increase over the last three years and a 20.5% rise over five years, underscores a steady enhancement in MSCI's financial health and profitability. Such growth is indicative of strategic foresight in capital allocation.
| Time | Growth |
|---|---|
| 3 years | 20.70% |
| 5 years | 20.50% |
The average dividend growth is 20.5% over 5 years. This shows moderate but steady dividend growth.
✅ Payout Ratio
Maintaining a sensible payout ratio is pivotal to ensuring sustainability. With 40.80% of EPS and 33.89% of Free Cash Flow used for dividends, MSCI displays cautious fiscal management, ensuring dividends are well-covered by earnings and cash flow.
| Key Figure | Ratio |
|---|---|
| EPS-based | 40.80% |
| Free cash flow-based | 33.89% |
These payout ratios reflect prudent management, balancing rewarding shareholders and maintaining financial flexibility.
✅ Cashflow & Capital Efficiency
Cash flow metrics are fundamental in evaluating operational efficacy and capital allocation. MSCI's healthy free cash flow yield and high free cash flow to operating cash flow ratio depict strong liquidity and stable cash operations. Efficient CAPEX management further boosts capital efficiency.
| 2024 | 2023 | 2022 | |
|---|---|---|---|
| Free Cash Flow Yield | 3.31% | 2.55% | 2.72% |
| Earnings Yield | 2.35% | 2.56% | 2.32% |
| CAPEX to Op. Cash Flow | 2.27% | 7.35% | 6.65% |
| Stock-based Comp. to Revenue | 3.33% | 2.83% | 2.58% |
| FCF / Op. Cash Flow Ratio | 97.75% | 92.65% | 93.34% |
MSCI exhibits commendable cash flow stability with substantial capital efficiency, indicative of a robust foundation for ongoing growth and profitability.
⚠️ Balance Sheet & Leverage Analysis
Analysis reveals a concerning leverage position, with negative equity ratios indicating potential volatility under adverse market conditions. Nevertheless, strong interest coverage and tangible asset ratios reflect adequate short-term liquidity and operational prudence.
| 2024 | 2023 | 2022 | |
|---|---|---|---|
| Debt-to-Equity | -4.93 | -6.26 | -4.61 |
| Debt-to-Assets | 0.85 | 0.84 | 0.93 |
| Debt-to-Capital | 1.25 | 1.19 | 1.28 |
| Net Debt to EBITDA | 2.42 | 2.43 | 2.69 |
| Current Ratio | 0.88 | 0.93 | 1.39 |
| Quick Ratio | 0.85 | 0.93 | 1.40 |
| Financial Leverage | -5.79 | -7.46 | -4.96 |
While the debt ratios raise alarms about leverage, the company's operational capacity and productive assets provide reassurance of financial stability.
✅ Fundamental Strength & Profitability
Capturing fundamental strength, MSCI's profitability metrics reveal excellent margins with robust R&D investments. Despite a negative ROE, returns on assets and invested capital present positive signs of operational effectiveness.
| 2024 | 2023 | 2022 | |
|---|---|---|---|
| Return on Equity | -1.18% | -1.55% | -0.86% |
| Return on Assets | 0.20% | 0.21% | 0.17% |
| Net Margin | 38.83% | 45.42% | 38.72% |
| EBIT Margin | 53.98% | 61.52% | 54.05% |
| EBITDA Margin | 61.20% | 67.81% | 60.39% |
| Gross Margin | 81.99% | 82.34% | 82.02% |
| R&D to Revenue | 5.73% | 5.22% | 4.77% |
Strong profitability metrics and deliberate R&D spend solidify MSCI's standing as a high-performing entity with enduring potential.
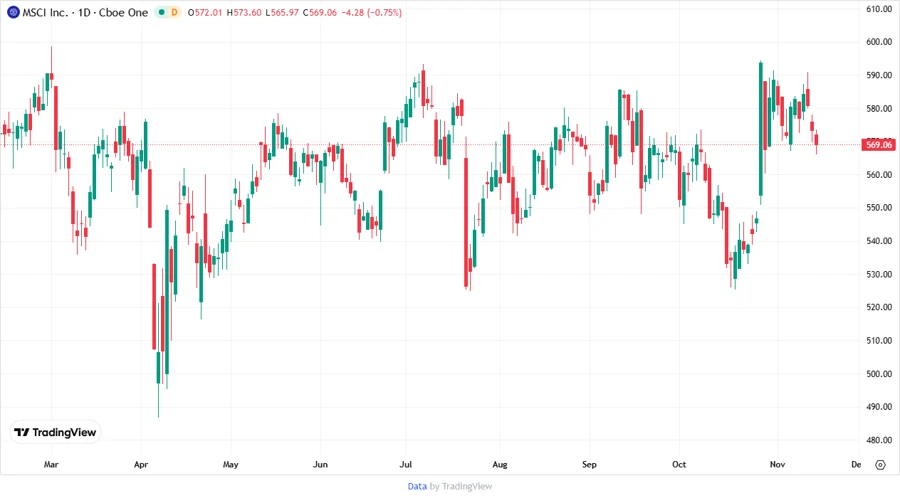
📉 Price Development
🧮 Dividend Scoring System
| Criteria | Score (1-5) | |
|---|---|---|
| Dividend Yield | 3 | |
| Dividend Stability | 4 | |
| Dividend Growth | 4 | |
| Payout Ratio | 5 | |
| Financial Stability | 3 | |
| Dividend Continuity | 5 | |
| Cashflow Coverage | 4 | |
| Balance Sheet Quality | 3 |
Total Score: 31/40
📊 Rating
MSCI Inc.'s dividend profile demonstrates disciplined financial governance, robust profitability, and a compelling growth trajectory. With the existing framework, it suggests a cautious yet favorable investment. Despite concerns about leverage, its commitment to consistent dividends and sound financial strategies render it a resilient contributor to an investment portfolio. MSCI Inc. receives a "Buy" recommendation with a focus on long-term growth.
Smart Data Insight
Master the Perfect Entry & Exit for this Stock
Don't leave your profits to chance. Historically, this stock follows specific seasonal patterns that institutional traders use to maximize returns.
- ✅ Identify the "Golden Buying Window"
- ✅ Avoid high-risk correction cycles
- ✅ Backtested data from the last 20+ years