November 12, 2025 a 12:47 pm

MSCI: Dividend Analysis - MSCI Inc.
MSCI Inc. continues to display its commitment to shareholder returns through consistent dividend payments. Its strategic positioning in the sector allows moderate but ongoing dividend growth, backed by stable financial health and robust capital management practices. Despite market volatilities, MSCI's dividends reflect financial prudence and a long-term growth trajectory.
📊 Overview
MSCI Inc. demonstrates a stable presence in its sector, with a current dividend yield aligning well with industry standards. The company’s robust dividend history indicates a commitment to shareholders, having consistently provided returns over the years.
| Metric | Value |
|---|---|
| Sector | Financial Services |
| Dividend yield | 1.23% |
| Current dividend per share | 6.47 USD |
| Dividend history | 12 years |
| Last cut or suspension | None |
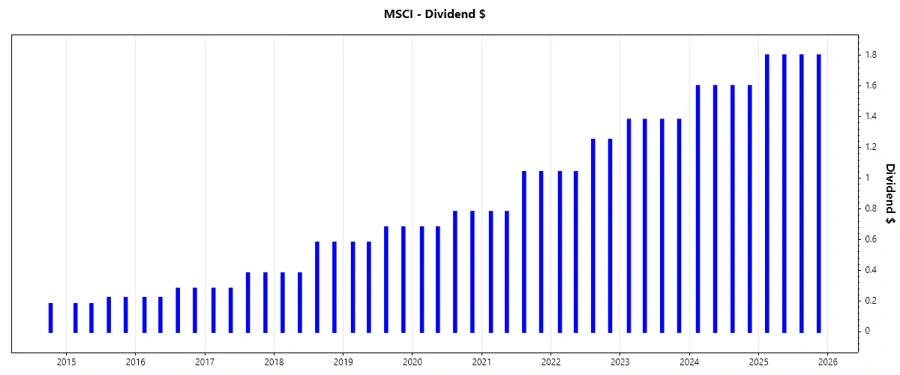
🗣️ Dividend History
The dividend history of MSCI Inc. reflects stable growth over the years, enhancing shareholder value. This reliability showcases the corporation's consistent financial strategy and commitment to returning profits to investors.
| Year | Dividend Per Share (USD) |
|---|---|
| 2025 | 7.20 |
| 2024 | 6.40 |
| 2023 | 5.52 |
| 2022 | 4.58 |
| 2021 | 3.64 |
📈 Dividend Growth
Dividend growth is a critical indicator of an organization's commitment to increasing shareholder wealth over time. MSCI exhibits moderate growth trends over the past years, pointing to a steady escalation in payouts.
| Time | Growth |
|---|---|
| 3 years | 20.70% |
| 5 years | 20.49% |
The average dividend growth is 20.49% over 5 years. This shows moderate but steady dividend growth.
⚠️ Payout Ratio
The payout ratio determines the sustainability of dividends paid by comparing them to a firm's earnings and free cash flow.
| Key Figure | Ratio |
|---|---|
| EPS-based | 40.80% |
| Free cash flow-based | 33.89% |
With an EPS-based payout ratio of 40.80% and an FCF-based payout ratio of 33.89%, MSCI demonstrates a balanced approach in utilizing its profits for dividends, suggesting a stable income distribution strategy.
📊 Cashflow & Capital Efficiency
Analyzing cash flows provides insights into MSCI's operational efficiency and investment capabilities, critical for sustaining its dividend policy and growth.
| Metric | 2024 | 2023 | 2022 |
|---|---|---|---|
| Free Cash Flow Yield | 3.11% | 2.55% | 2.72% |
| Earnings Yield | 2.35% | 2.56% | 2.32% |
| CAPEX to Operating Cash Flow | 2.25% | 7.35% | 6.65% |
| Stock-based Compensation to Revenue | 3.33% | 2.83% | 2.58% |
| Free Cash Flow / Operating Cash Flow Ratio | 97.75% | 92.65% | 93.35% |
MSCI's prudent management of cash flows underscores its capability to sustain dividend payouts while ensuring growth in capital efficiency through strategic investments.
⚠️ Balance Sheet & Leverage Analysis
A healthy balance sheet reflects a firm’s ability to meet its long-term obligations, an essential factor for evaluating dividend reliability and capital structuring.
| Metric | 2024 | 2023 | 2022 |
|---|---|---|---|
| Debt-to-Equity | -4.93 | -6.26 | -4.61 |
| Debt-to-Assets | 85.06% | 83.87% | 92.92% |
| Debt-to-Capital | 125.46% | 119.03% | 127.72% |
| Net Debt to EBITDA | 2.42 | 2.43 | 2.69 |
| Current Ratio | 0.85 | 0.93 | 1.40 |
| Quick Ratio | 0.85 | 0.93 | 1.40 |
| Financial Leverage | -5.79 | -7.46 | -4.96 |
Despite the high leverage ratios, MSCI's strategic leverage indicates potential for risk mitigation and growth through structured capital management, making it essential for cautious dividend investing.
📈 Fundamental Strength & Profitability
Evaluating profitability helps investors understand how well a company generates profits relative to its sales, increasing confidence in dividend sustainability.
| Metric | 2024 | 2023 | 2022 |
|---|---|---|---|
| Return on Equity | -117.99% | -155.26% | -86.37% |
| Return on Assets | 20.37% | 20.81% | 17.42% |
| Return on Invested Capital | 32.39% | 28.95% | 26.82% |
| Net Margin | 38.83% | 45.42% | 38.72% |
| EBIT Margin | 53.98% | 61.52% | 54.05% |
| EBITDA Margin | 61.20% | 67.81% | 60.39% |
| Gross Margin | 81.99% | 82.34% | 82.01% |
| R&D to Revenue | 5.73% | 5.22% | 4.77% |
MSCI’s profitability indicators demonstrate solid operational efficiency, translating into consistent dividend prospects, despite concerns over return metrics due to high leverage.
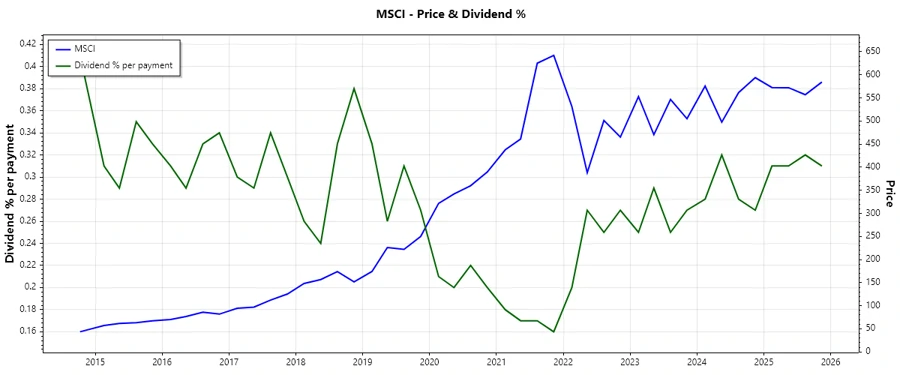
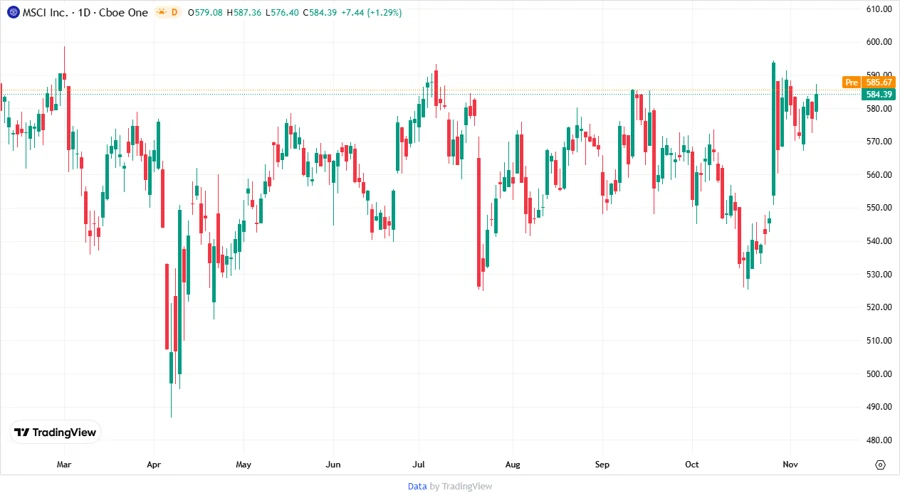
📊 Price Development
📈 Dividend Scoring System
Our dividend scoring system evaluates critical metrics to determine the attractiveness of MSCI's dividend policy.
| Criterion | Description | Score |
|---|---|---|
| Dividend Yield | Reflects return per share | |
| Dividend Stability | Consistency over time | |
| Dividend Growth | Increase in payouts | |
| Payout Ratio | Proportion of earnings paid | |
| Financial Stability | Debt and leverage management | |
| Dividend Continuity | Unbroken history | |
| Cashflow Coverage | Ability to cover dividends with cash flow | |
| Balance Sheet Quality | Overall financial health |
Overall Score: 31/40
✅ Rating
MSCI Inc. showcases a reliable dividend payment structure founded on sound financial strategies. Despite challenges in leverage, its ability to consistently grow and pay dividends makes it a favorable candidate for income-focused investors seeking stability and moderate growth in returns.
Smart Data Insight
Master the Perfect Entry & Exit for this Stock
Don't leave your profits to chance. Historically, this stock follows specific seasonal patterns that institutional traders use to maximize returns.
- ✅ Identify the "Golden Buying Window"
- ✅ Avoid high-risk correction cycles
- ✅ Backtested data from the last 20+ years