August 08, 2025 a 11:31 am

MSCI: Dividend Analysis - MSCI Inc.
MSCI Inc. presents a relatively stable dividend profile with a consistent dividend yield of 1.28%. Despite facing challenges in its financial ratios, the company maintains a strong dividend distribution track record. The firm's emphasis on steady growth positions it as a noteworthy player for dividend-focused investors.
📊 Overview
The analysis of MSCI Inc. reveals its positioning within the market sector, dividend trends, and payout history. The firm operates in the Finance sector with a current dividend yield of 1.28%. MSCI's current dividend per share stands at 6.47 USD, with a 12-year history of uninterrupted dividends.
| Metric | Value |
|---|---|
| Sector | Finance |
| Dividend yield | 1.28% |
| Current dividend per share | 6.47 USD |
| Dividend history | 12 years |
| Last cut or suspension | None |
📈 Dividend History
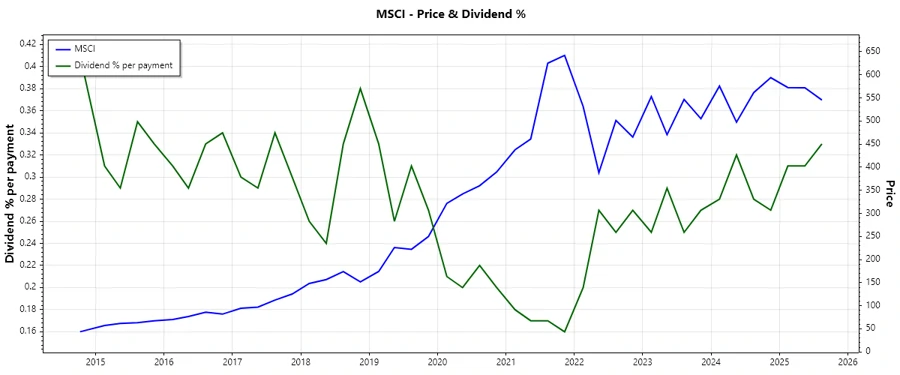
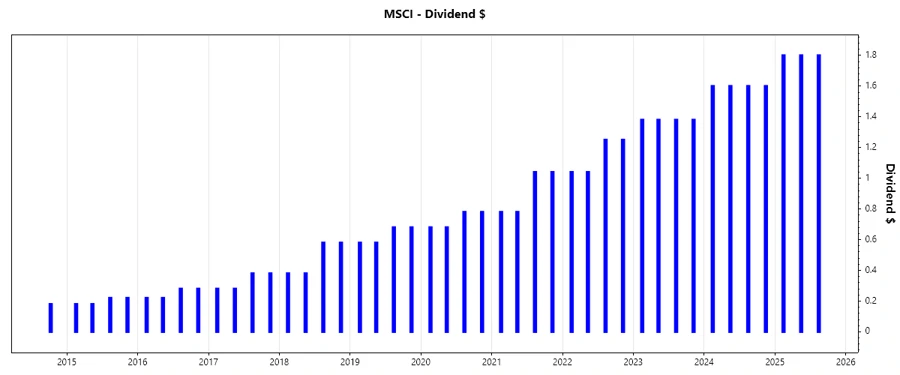
Understanding the dividend history is crucial as it reflects the company's ability and commitment to return value to shareholders. MSCI Inc. has shown consistent dividend growth, which is a positive indicator for potential investors.
| Year | Dividend Per Share (USD) |
|---|---|
| 2025 | 5.4 |
| 2024 | 6.4 |
| 2023 | 5.52 |
| 2022 | 4.58 |
| 2021 | 3.64 |
📉 Dividend Growth
Dividend growth over time is a key metric for evaluating the sustainability and attractiveness of a dividend stock. MSCI has realized a 20.69% dividend growth over the past 3 years and a 20.49% growth over 5 years. This trend suggests moderate but steady dividend increments.
| Time | Growth |
|---|---|
| 3 years | 20.70% |
| 5 years | 20.49% |
The average dividend growth is 20.49% over 5 years. This shows moderate but steady dividend growth.
🗣️ Payout Ratio
The payout ratio signifies a company's ability to cover dividends with its earnings. A lower ratio generally indicates sustainable dividend payouts. MSCI shows an EPS-based payout ratio of 42.47% and a free cash flow-based payout ratio of 34.60%.
| Key figure | Ratio |
|---|---|
| EPS-based | 42.47% |
| Free cash flow-based | 34.60% |
The EPS payout ratio of 42.47% and FCF payout ratio of 34.60% indicate a healthy dividend sustainability, given the company's current earnings and cash flow generation capacity.
⭐ Cashflow & Capital Efficiency
An analysis of cash flow and capital efficiency shows how well a company utilizes its capital investments and generates cash flow. These metrics are integral for understanding financial stability and future growth potential.
| Year | 2024 | 2023 | 2022 |
|---|---|---|---|
| Free Cash Flow Yield | 3.11% | 2.55% | 2.72% |
| Earnings Yield | 2.35% | 2.56% | 2.32% |
| CAPEX to Operating Cash Flow | 2.25% | 7.35% | 6.65% |
| Stock-based Compensation to Revenue | 3.33% | 2.83% | 2.58% |
| Free Cash Flow / Operating Cash Flow Ratio | 97.75% | 92.65% | 93.35% |
The data reflects MSCI Inc.'s strong operational efficiencies and effective use of capital. With stable free cash flow yields and efficient capital allocation, the company is poised for healthy financial stability.
📊 Balance Sheet & Leverage Analysis
Evaluating the leverage and capital structure provides insights into the financial risk and stability of a company. These metrics inform about debt management and liquidity positioning.
| Year | 2024 | 2023 | 2022 |
|---|---|---|---|
| Debt-to-Equity | -4.93 | -6.26 | -4.61 |
| Debt-to-Assets | 85.06% | 83.87% | 92.92% |
| Debt-to-Capital | 125.46% | 119.03% | 127.72% |
| Net Debt to EBITDA | 2.42 | 2.43 | 2.69 |
| Current Ratio | 0.85 | 0.93 | 1.40 |
| Quick Ratio | 0.85 | 0.93 | 1.37 |
| Financial Leverage | -5.79 | -7.46 | -4.96 |
MSCI Inc.'s balance sheet analysis highlights a complex leverage situation with negative debt-to-equity ratios. However, liquidity ratios suggest moderate leverage management, requiring cautious observation.
📈 Fundamental Strength & Profitability
A thorough look at profitability and fundamental strengths uncovers the core revenue-generating capabilities and operational margins, vital for evaluating long-term growth potential.
| Year | 2024 | 2023 | 2022 |
|---|---|---|---|
| Return on Equity | -1.18 | -1.55 | -0.86 |
| Return on Assets | 0.20 | 0.21 | 0.17 |
| Margins: Net | 38.83% | 45.42% | 38.72% |
| Margins: EBIT | 53.98% | 61.52% | 54.05% |
| Margins: EBITDA | 61.20% | 67.81% | 60.39% |
Despite negative returns on equity, MSCI Inc. demonstrates strong EBIT and EBITDA margins, indicating stable operational efficiency. The firm shows significant profitability potential, crucial for investor confidence.
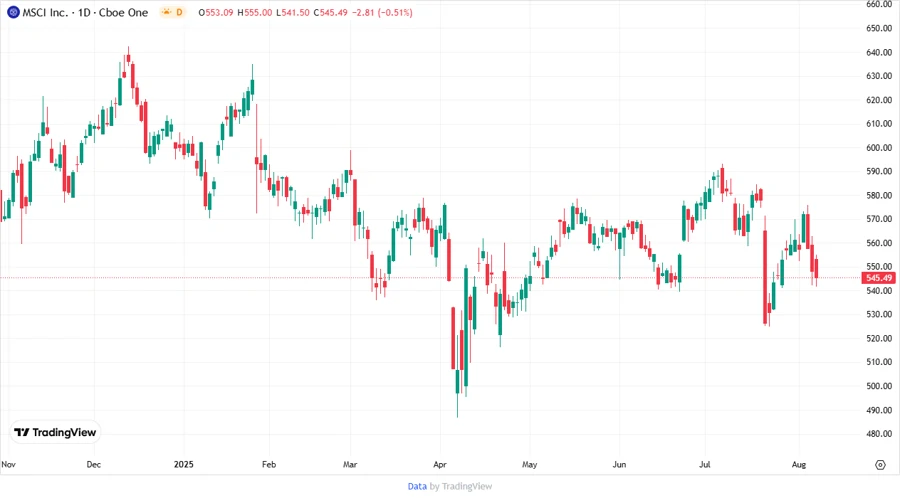
📊 Price Development
⚙️ Dividend Scoring System
| Category | Score | Representation |
|---|---|---|
| Dividend yield | 3 | |
| Dividend Stability | 4 | |
| Dividend growth | 4 | |
| Payout ratio | 4 | |
| Financial stability | 3 | |
| Dividend continuity | 5 | |
| Cashflow Coverage | 4 | |
| Balance Sheet Quality | 3 |
Overall Score: 30 out of 40
✅ Rating
MSCI Inc. shows promising attributes for dividend-seeking investors, evidenced by its stable dividend history and moderate growth potential. However, close monitoring of its financial and leverage ratios is advised, given the current economic environment and their implications on future dividend sustainability. Overall, MSCI remains an attractive prospect for those focusing on dividend income, with a total score of 30 out of 40.
Smart Data Insight
Master the Perfect Entry & Exit for this Stock
Don't leave your profits to chance. Historically, this stock follows specific seasonal patterns that institutional traders use to maximize returns.
- ✅ Identify the "Golden Buying Window"
- ✅ Avoid high-risk correction cycles
- ✅ Backtested data from the last 20+ years