September 28, 2025 a 04:44 pm
MRNA: Fibonacci Analysis - Moderna, Inc.
Moderna, Inc. (MRNA) has experienced significant shifts in its stock price over recent months. Given the company's pivotal role in mRNA-based vaccines and therapeutics, there's a keen interest from investors in understanding its market movements. The analysis below focuses on the technical aspect, exploring recent price trends and retracement levels.
Fibonacci Analysis
| Analysis Detail | Value |
|---|---|
| Start Date of Trend | 2024-09-30 |
| End Date of Trend | 2025-09-26 |
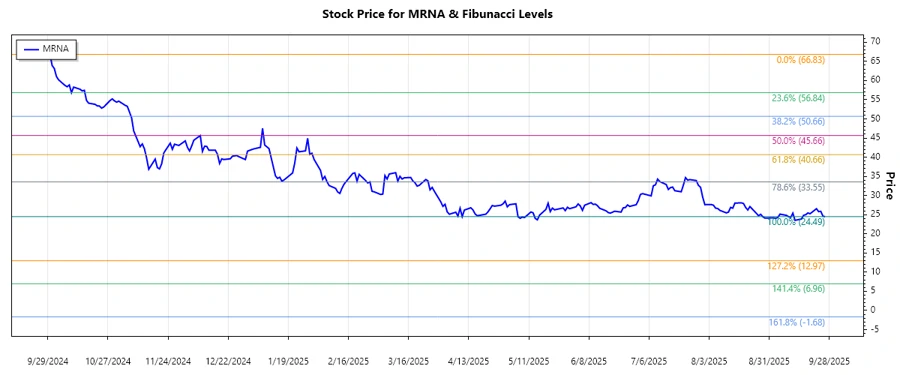
| High Point (Price & Date) | $66.83 on 2024-09-30 |
| Low Point (Price & Date) | $24.49 on 2025-09-26 |
| 0.236 Retracement Level | $35.96 |
| 0.382 Retracement Level | $40.32 |
| 0.5 Retracement Level | $45.66 |
| 0.618 Retracement Level | $50.99 |
| 0.786 Retracement Level | $56.72 |
The current price is in the 0.236 to 0.382 retracement zone, suggesting a potential support area. This level is critical for traders looking for a reversal closer to the 0.236 level or a continuation towards lower Fibonacci levels.
Conclusion
Moderna's stock has faced a pronounced downward trend from its high in September 2024. The application of Fibonacci retracement levels provides insight into areas where this price decline might find interim support or resistance. As Moderna continues to innovate in vaccine development, volatility in its stock remains a constant. Investors should remain cautious, as the bearish trend suggests further price challenges, although technical support might offer temporary relief. Careful monitoring of future price action is recommended to gauge the validity of these retracement levels as effective supports or to identify further bearish pressures.
Smart Data Insight
Master the Perfect Entry & Exit for this Stock
Don't leave your profits to chance. Historically, this stock follows specific seasonal patterns that institutional traders use to maximize returns.
- ✅ Identify the "Golden Buying Window"
- ✅ Avoid high-risk correction cycles
- ✅ Backtested data from the last 20+ years