August 12, 2025 a 11:44 am
MRNA: Fibonacci Analysis - Moderna, Inc.
Moderna, Inc. has seen notable price volatility, particularly as it navigates the fluctuating demand for its mRNA-based products. Recent months have shown a persistent downward trend, culminating in a significant bottom. With strategic partnerships and a robust pipeline of therapeutics, the company's stock is a point of interest for investors seeking potential rebounds or further downside risks. The technical analysis suggests crucial levels to watch for potential reversals or continuations in the trend.
Fibonacci Analysis
| Detail | Information |
|---|---|
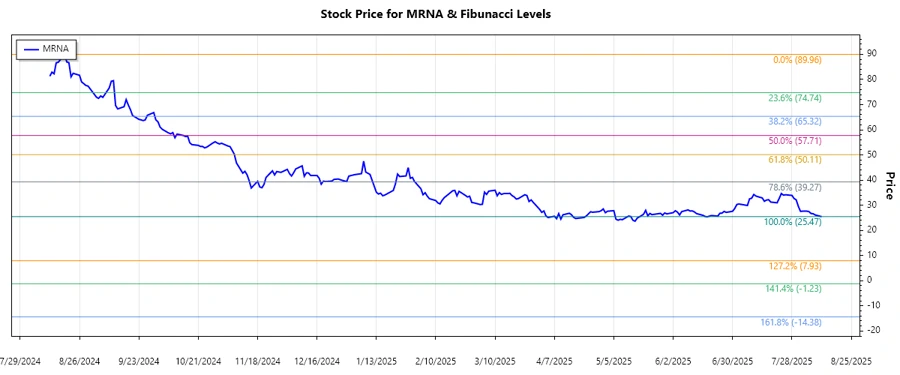
| Trend Period | June 11, 2024 - August 11, 2025 |
| High Point | $89.96 on August 19, 2024 |
| Low Point | $25.47 on August 11, 2025 |
| Fibonacci Level | Price Level |
|---|---|
| 0.236 | $46.53 |
| 0.382 | $54.01 |
| 0.5 | $57.72 |
| 0.618 | $61.43 |
| 0.786 | $67.18 |
The current price of $27.47 is below the Fibonacci retracement levels, not currently indicating presence in a retracement zone. This suggests potential strong resistance at the lower Fibonacci levels before reaching $46.53.
Technically, this indicates continued bearish momentum unless the price breaks above these retracement levels, potentially signifying a reversal or a correction phase.
Conclusion
Moderna's stock has experienced a prolonged downtrend but holds strategic value due to its innovative research and established partnerships. The current technical setup reveals strong resistance points that the stock needs to surpass for any meaningful trend reversal. However, if the price remains suppressed under these levels, further downside could be anticipated. Investors should remain vigilant of these retracement levels, which could offer insights into future price action, either indicating potential rebounds or an alignment with the prolonged bearish trend.
JSON-Data:
Smart Data Insight
Master the Perfect Entry & Exit for this Stock
Don't leave your profits to chance. Historically, this stock follows specific seasonal patterns that institutional traders use to maximize returns.
- ✅ Identify the "Golden Buying Window"
- ✅ Avoid high-risk correction cycles
- ✅ Backtested data from the last 20+ years