
June 29, 2026 a 02:03 pm

MRK: Trend and Support & Resistance Analysis - Merck & Co., Inc.
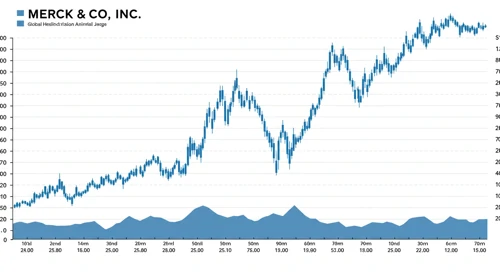
The recent analysis of Merck & Co., Inc. exhibits varying trends over the past months. There is a significant observation of shifting dynamics within the stock’s movement, reflecting upon the volatility within the healthcare sector. As a global leader in pharmaceuticals and animal health, the stock’s performance is also impacted by collaborations and market demands. The technical indicators, such as EMA, provide us with insights into the possible upcoming trends. Understanding these indicators can guide future investment decisions.
Trend Analysis
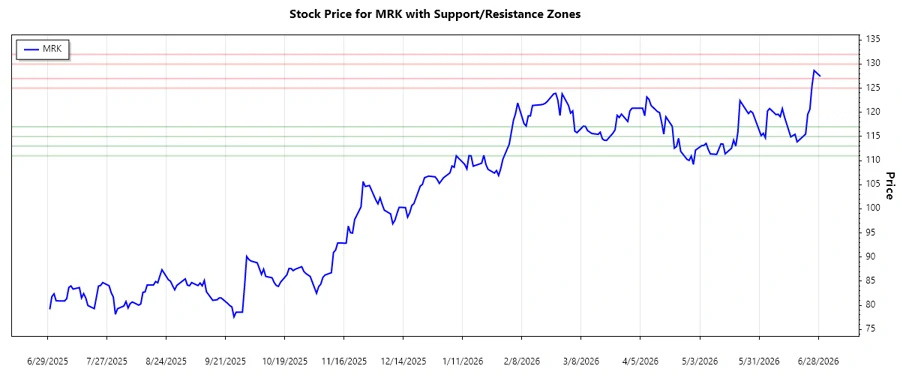
The following analysis on MRK's stock trend is based on the latest closing prices. By calculating the 20-day and 50-day Exponential Moving Averages (EMA), it appears:
| Date | Close Price | Trend |
|---|---|---|
| 2026-06-29 | 127.44 | ▲ Uptrend |
| 2026-06-26 | 128.66 | ▲ Uptrend |
| 2026-06-25 | 125.45 | ▲ Uptrend |
| 2026-06-24 | 120.6 | ▲ Uptrend |
| 2026-06-23 | 119.6 | ▲ Uptrend |
| 2026-06-22 | 115.48 | ▲ Uptrend |
| 2026-06-18 | 113.87 | ▲ Uptrend |
With EMA20 greater than EMA50, MRK is in an ▲ uptrend scenario. Such an upward trajectory suggests positive momentum within the stock, indicating potentially favorable conditions for buying.
Support and Resistance
Analyzing the support and resistance levels offers additional insights into MRK's potential movement:
| Zone Type | Zone Levels |
|---|---|
| Support Level 1 | 115.00 - 117.00 ▼ |
| Support Level 2 | 111.00 - 113.00 ▼ |
| Resistance Level 1 | 125.00 - 127.00 ▲ |
| Resistance Level 2 | 130.00 - 132.00 ▲ |
The current price lies close to the higher resistance zone, indicating possible challenges in breaching this level unless substantial market or company-driven catalysts emerge.
Conclusion
In conclusion, Merck & Co., Inc. displays a compelling movement characterized by an uptrend with the potential to encounter resistance levels in the near term. This suggests an opportunity for investors but also warrants caution should the resistance levels prove more robust. Its stable position within the pharmaceuticals and healthcare segment could provide a solid foundation for sustained growth. While the potential for upside is present, key resistance levels should not be taken lightly.
Smart Data Insight
Master the Perfect Entry & Exit for this Stock
Don't leave your profits to chance. Historically, this stock follows specific seasonal patterns that institutional traders use to maximize returns.
- ✅ Identify the "Golden Buying Window"
- ✅ Avoid high-risk correction cycles
- ✅ Backtested data from the last 20+ years