September 12, 2025 a 04:03 amHier ist die angeforderte technische Analyse von Merck & Co., Inc. (MRK) basierend auf den bereitgestellten Daten:

MRK: Trend and Support & Resistance Analysis - Merck & Co., Inc.
Merck & Co., Inc. operates as a global healthcare company, offering a diverse range of human and animal health products. With its strong focus on pharmaceutical innovation, MRK continues to be a key player in the healthcare sector. Recent stock trends indicate a mixed performance, reflecting broader market conditions and specific industry challenges.
Trend Analysis
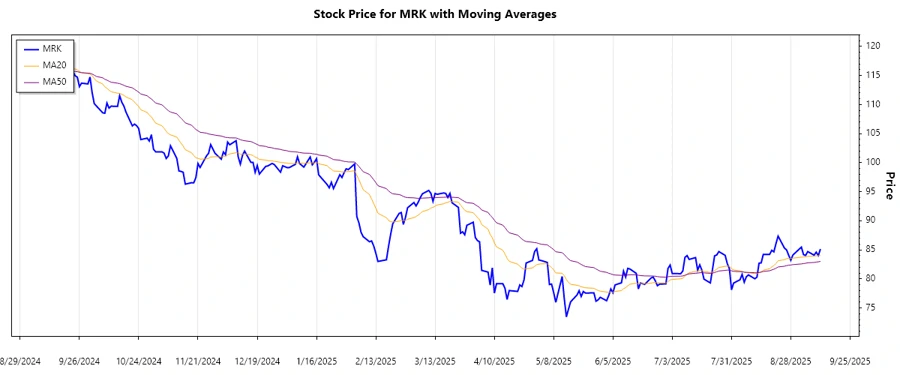
Analyzing the historical price data for MRK, we can observe mixed trends in recent months. The stock has experienced fluctuations, reflecting broader economic and sector-specific dynamics. To determine the current trend, the EMA20 and EMA50 are calculated. A comparison shows:
| Date | Close Price | Trend |
|---|---|---|
| 2025-09-11 | $85.15 | ⚖️ |
| 2025-09-10 | $84.03 | ⚖️ |
| 2025-09-09 | $84.61 | ⚖️ |
| 2025-09-08 | $84.09 | ⚖️ |
| 2025-09-05 | $84.71 | ⚖️ |
| 2025-09-04 | $84.05 | ⚖️ |
| 2025-09-03 | $84.18 | ⚖️ |
Given the close values, the current trend is demonstrating a sideways movement. The EMA20 is converging with the EMA50, signaling a lack of clear directional momentum.
Support and Resistance
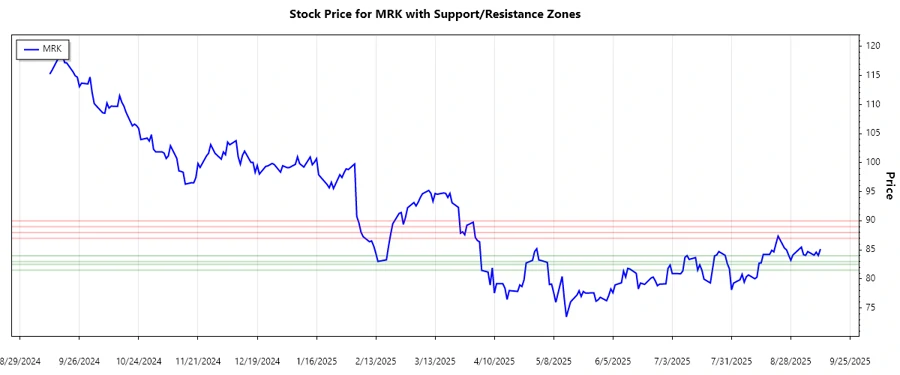
By examining the price data, key support and resistance zones can be identified. These zones are crucial for predicting potential reversal levels and gauging market sentiment.
| Zone Type | From | To |
|---|---|---|
| Support | $83.00 | $84.00 |
| Support | $81.50 | $82.50 |
| Resistance | $87.00 | $88.00 |
| Resistance | $89.00 | $90.00 |
The current price hovers within a support zone of $83.00 - $84.00, suggesting potential upward pressure if this level holds firm.
Conclusion
Merck & Co., Inc. (MRK) is presently exhibiting a sideways trend, reflecting uncertainty and consolidation in price movement. The EMA convergence further accentuates this indecisiveness in the market. Support and resistance levels provide critical insights into potential price reversals. Investors should be cautious, monitoring for breakouts above the $87.00 - $88.00 resistance for potential bullish signals or a breakdown below $83.00 for bearish implications. Given Merck's robust portfolio and strategic partnerships, opportunities abound, although macroeconomic factors and industry shifts remain key risks to watch.
Smart Data Insight
Master the Perfect Entry & Exit for this Stock
Don't leave your profits to chance. Historically, this stock follows specific seasonal patterns that institutional traders use to maximize returns.
- ✅ Identify the "Golden Buying Window"
- ✅ Avoid high-risk correction cycles
- ✅ Backtested data from the last 20+ years