
July 25, 2026 a 05:15 am
MRK: Fibonacci Analysis - Merck & Co., Inc.
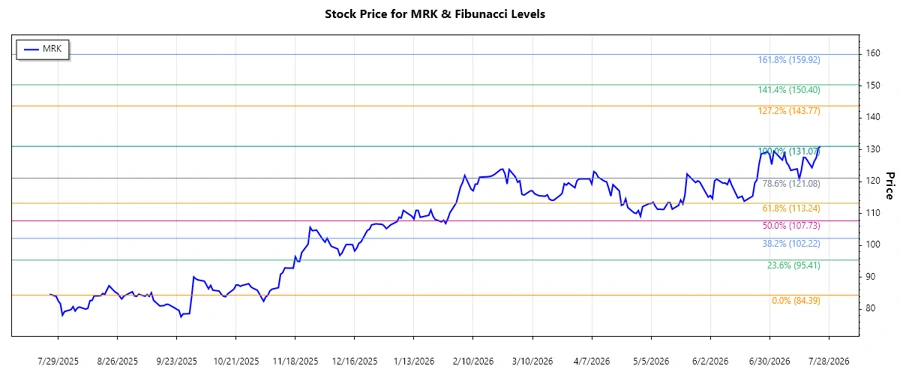
The Merck & Co., Inc. stock has witnessed a robust uptrend in recent months, leading to renewed interest among investors. This healthcare leader has shown resilience, with its Pharmaceuticals and Animal Health segments contributing significantly to its growth trajectory. Analyzing the current technical patterns can help identify potential opportunities or risks for investors.
Fibonacci Analysis
| Aspect | Details |
|---|---|
| Start Date | 2025-11-06 |
| End Date | 2026-07-24 |
| High Point | 131.07 (2026-07-24) |
| Low Point | 84.39 (2025-11-06) |
| Fibonacci Levels |
|
| Current Price Position | Price is above 131.07; outside retracement zones |
| Technical Interpretation | The stock is showing strong momentum above its high point, indicating potential for further gains. Resistance may form around the most recent high, while retracement levels could act as support if a pullback occurs. |
Conclusion
The upward movement in Merck & Co., Inc.'s stock underscores its robust fundamentals and positive market sentiment, presenting lucrative opportunities for investors. However, the adherence to technical levels like Fibonacci suggests monitoring for potential corrections. Continued strength could signify sustained growth, though changes in market conditions and business dynamics, such as strategic partnerships or regulatory shifts, could pose risks. Overall, the current trend favors a cautiously optimistic outlook for Merck's future performance.
Smart Data Insight
Master the Perfect Entry & Exit for this Stock
Don't leave your profits to chance. Historically, this stock follows specific seasonal patterns that institutional traders use to maximize returns.
- ✅ Identify the "Golden Buying Window"
- ✅ Avoid high-risk correction cycles
- ✅ Backtested data from the last 20+ years