November 17, 2025 a 06:44 am

MRK: Fibonacci Analysis - Merck & Co., Inc.
Merck & Co., Inc. has shown a dominating upward trend over the past few months, driven by strong performance in their pharmaceutical segment and successful collaborations. Investors are optimistic about Merck's innovative capabilities and market reach in the healthcare sector, especially in areas like oncology and vaccines. This trend might be indicative of investor confidence in the company's future growth prospects.
Fibonacci Analysis
| Aspect | Details | ||||||||||||
|---|---|---|---|---|---|---|---|---|---|---|---|---|---|
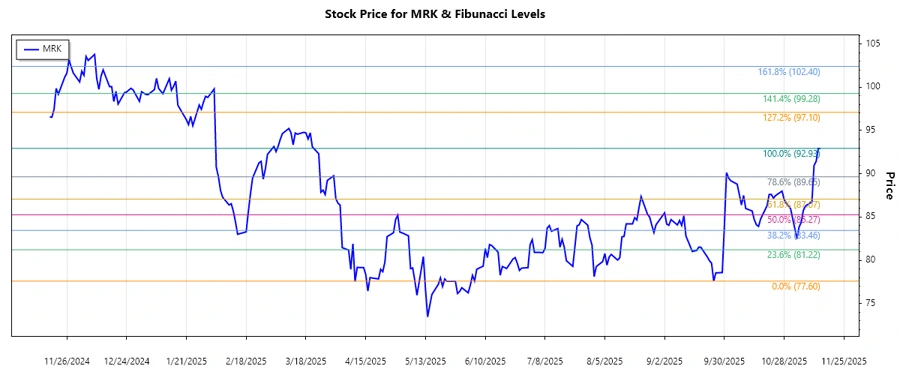
| Trend Period | 2025-09-29 to 2025-11-14 | ||||||||||||
| High Point | $92.93 on 2025-11-13 | ||||||||||||
| Low Point | $77.60 on 2025-09-25 | ||||||||||||
| Fibonacci Levels |
|
||||||||||||
| Current Price | $92.92 | ||||||||||||
| Retracement Zone | None - Above 0.786 | ||||||||||||
| Interpretation | The stock is currently trading above the 0.786 retracement level, indicating strong bullish sentiment with potential support at the previous high levels. |
Conclusion
The Merck & Co., Inc. stock has experienced a significant upward trend, with prices currently exceeding the 0.786 Fibonacci level. This indicates a robust bullish momentum, supported by the company's strategic initiatives and market presence. While this suggests potential further gains, investors should be cautious of possible reversals. Key support levels can be expected at previous Fibonacci levels. Overall, Merck & Co.'s market position and innovative strength offer promising long-term growth potential, though external market factors must be closely monitored.
Smart Data Insight
Master the Perfect Entry & Exit for this Stock
Don't leave your profits to chance. Historically, this stock follows specific seasonal patterns that institutional traders use to maximize returns.
- ✅ Identify the "Golden Buying Window"
- ✅ Avoid high-risk correction cycles
- ✅ Backtested data from the last 20+ years