November 01, 2025 a 06:44 am
MRK: Fibonacci Analysis - Merck & Co., Inc.
Merck & Co., Inc., with its expansive healthcare operations, has demonstrated robust financial health over the past months. The stock has been following a pronounced downward trend, approaching key support levels. As a global healthcare leader, Merck’s diverse product segments may offer stability despite market volatilities.
Fibonacci Analysis
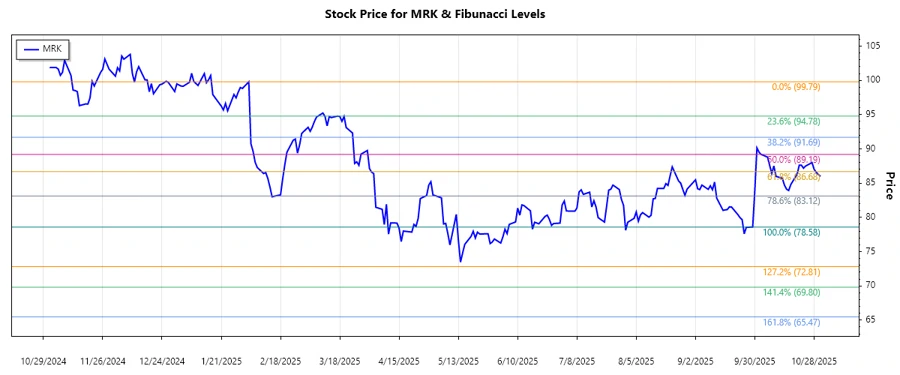
This analysis identifies the dominant trend in the stock of Merck & Co., Inc., which has been in a downward trajectory. Employing Fibonacci retracement levels helps us gauge potential bounce-back or further declines based on historical price movement.
| Key Data | Details |
|---|---|
| Trend Start Date | 2025-01-03 |
| Trend End Date | 2025-09-30 |
| High Price (2025-01-03) | 99.79 |
| Low Price (2025-09-29) | 78.58 |
| Fibonacci Level | Price Level |
|---|---|
| 0.236 | 84.39 |
| 0.382 | 87.05 |
| 0.500 | 89.19 |
| 0.618 | 91.33 |
| 0.786 | 94.01 |
Currently, the price is near the 0.382 Fibonacci level, indicating it is in a potential retracement zone. This area may act as a temporary resistance or a reversal point.
The recent price movement of MRK reflects a possible consolidation, with Fibonacci levels providing insight into critical price hurdles that could aid traders in setting stop-loss or take-profit strategies.
Conclusion
This downward trend in Merck & Co., Inc.'s stock price represents a significant move, reflecting broader market uncertainties. While the Fibonacci retracement highlights possible levels of interest, investors must consider external factors such as market conditions and company-specific announcements. Being in a crucial retracement level, any positive news might propel prices higher, yet caution is advised should the stock break through support levels. Monitoring these levels can facilitate informed trading and investment strategies.
Smart Data Insight
Master the Perfect Entry & Exit for this Stock
Don't leave your profits to chance. Historically, this stock follows specific seasonal patterns that institutional traders use to maximize returns.
- ✅ Identify the "Golden Buying Window"
- ✅ Avoid high-risk correction cycles
- ✅ Backtested data from the last 20+ years