July 04, 2025 a 11:44 am
MRK: Fibonacci Analysis - Merck & Co., Inc.
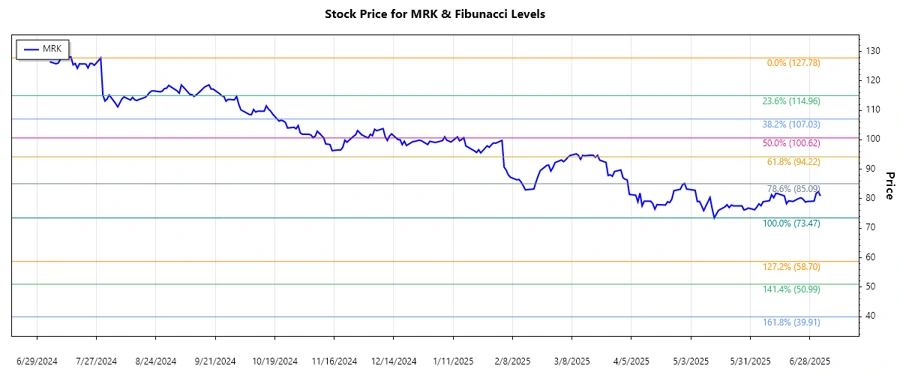
Merck & Co., Inc.'s share price has experienced significant fluctuations with periods of both ups and downs. Most recently, the trend has predominantly moved downward. This presents an interesting opportunity to apply technical analysis tools like Fibonacci Retracements to predict potential price levels and assess possible support or resistance zones. Given the healthcare sector's dynamic environment, Merck's strategic collaborations further enhance its market positioning.
Fibonacci Analysis
| Detail | Value |
|---|---|
| Trend Start Date | 2024-07-29 |
| Trend End Date | 2025-07-03 |
| High Price | $127.78 (2024-07-29) |
| Low Price | $73.47 (2025-05-14) |
| Fibonacci Level 0.236 | $85.45 |
| Fibonacci Level 0.382 | $94.50 |
| Fibonacci Level 0.5 | $100.63 |
| Fibonacci Level 0.618 | $106.75 |
| Fibonacci Level 0.786 | $115.01 |
| Current Price Status | The current price is in the 0.5 retracement area, indicating potential consolidation or reversal. |
Conclusion
The analysis identifies MRK in a classic downward regression from its high on July 29, 2024, to its low in mid-May 2025. While MRK's price currently resides around the 0.5 Fibonacci retracement level, a crucial pivot point, it signifies possible support, resisting further declines if respected. However, falling below this could suggest further descent towards deeper retracement levels. This highlights the significance of this mid-range level in signaling either a trend continuation or the onset of a reversal.
Smart Data Insight
Master the Perfect Entry & Exit for this Stock
Don't leave your profits to chance. Historically, this stock follows specific seasonal patterns that institutional traders use to maximize returns.
- ✅ Identify the "Golden Buying Window"
- ✅ Avoid high-risk correction cycles
- ✅ Backtested data from the last 20+ years